Another “Solar System” on HTML5 Canvas
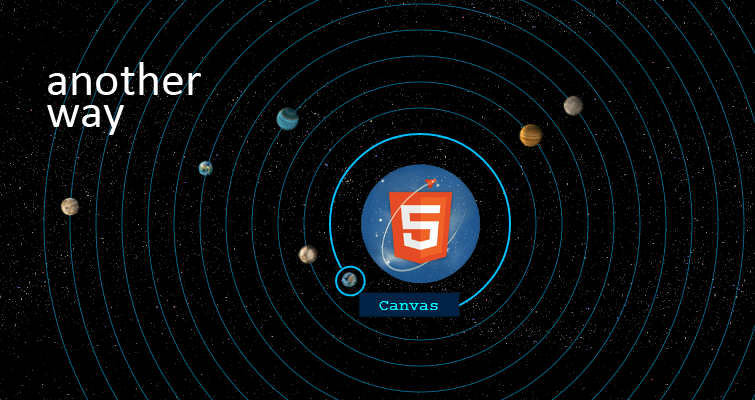
Before the New Year, two topics were published on Habré ( first , second ) about creating the “Solar System” on HTML5 Canvas. Having read them through and examined the results of the profiling, I was surprised that such a simple program works so inefficiently. Armed with Notepad ++ I decided to check everything is so bad by writing my own implementation.
TK remains the same. 12 planets, the circulation period of the first - 40 seconds, each subsequent for 20 seconds longer. Initially, the planets have a random arrangement in their orbits. Each planet has a description that is displayed when you hover over it. When you click on the planet, it stops. If the cursor is over the orbit - highlight it. All this should work in Opera 12+, IE9 +, Chrome and FF.
- I do not want to read anything, let's get the result!
- Hold: zhmyak
')
Let's get started I create a new directory in the Dropbox public folder. Standardly I divide the project into js / css / img directories, in the root I create the main.html file, which combines a set of scripts into one whole.
First lines
In the heritage from the previous implementations I got three pictures: the sun, the background and the tiles of the planets (in fact, there are more pictures). Great, now you need to somehow load the resources into the application, and describe the structural objects in one. By the way, I will have four objects: Point, Orbit, Planet and Tile. In order of each. Point is a service object, it has two fields, x and y - the position of a point on the canvas, and several methods: .set (), .clone (), .getDis () - set the coordinate values, clone the object and calculate the distance to another point. The Orbit object contains the center of the orbit, its radius and the planet that moves along it. (Ideally, the orbits should be described by formulas, but this is ideally, and I have all the orbits - circles). The third object is Planet. The planet has a name, a center point on the canvas, a radius, a moving speed, and an angle of inclination in degrees. The last Tile object stores an image and four values describing the position of the planet's image on the image: the coordinates of the upper left corner, the height and width. A tile has a .draw (x, y) method that draws it on a canvas at a specified point.
But why so much text, better code
// Point.js function Point(x, y) { this.x; this.y; this.set(x, y); // }; Point.prototype = { set: function(x, y) { this.x = x || 0; this.y = y || 0; }, getDis: function(other) { return Math.sqrt(Math.pow(other.x - this.x, 2) + Math.pow(other.y - this.y, 2)); }, clone: function() { return new Point(this.x, this.y); } }; // Orbit.js function Orbit(center, radius) { this.center = center; this.radius = radius; this.planet = null; // this.ctx = null; this.mouse = null; }; // Planet.js function Planet(orbit, radius, time) { this.pos = new Point(0, 0); this.orbit = orbit; this.radius = radius; this.speed = Math.PI*2 / (time * 1000); // this.angle = ~~(Math.random() * 360); // this.animate = true; this.name; this.tile; this.ctx; this.orbit.setProperty({'planet': this}); // }; // Tile.js function Tile(ctx, img, x, y, w, h) { this.ctx = ctx; // this.img = img; // - this.x = x; this.y = y; this.width = w; this.height = h; }; Tile.prototype = { draw: function(x, y) { this.ctx.drawImage(this.img, this.x, this.y, this.width, this.height, x, y, this.width, this.height); } }; /** * @param (object) property * @param (bool) add property, */ Object.prototype.setProperty = function(property, add) { if (add !== true) add = false; for (var key in property) { if (property.hasOwnProperty(key)) { if (typeof this[key] !== 'undefined' || add) { this[key] = property[key]; } } } return this; } In order not to write my own setter for each object, I decided to count and create the .setProperty () function in the Object prototype. The function adds new fields and changes the values of the old ones.
Let's go back to the image loader. With its implementation, I did not freeze, and made the traditional method: when adding a new image, I increase the counter of the added images, after loading the image - the counter is loaded. If the values of the counters match, then all the resources are loaded and you can start the application. This unloader has one big minus, you cannot dynamically load data, but in my case there is no need for this.
Loader
var IM = { // Images Manager store: {}, // imagesAdded: 0, // imagesLoaded: 0, // add: function(url, name) { // var self = this; var img = new Image(); img.onload = function() { self.imagesLoaded++; if (self.imagesAdded == self.imagesLoaded) { self.afterRun(); // , } } img.src = url; this.store[name] = img; this.imagesAdded++; }, afterRun: function() { // render(new Date() * 1); // } }; IM.add('img/sun.png', 'sun'); // IM.add('img/planets.png', 'planets'); // Planets
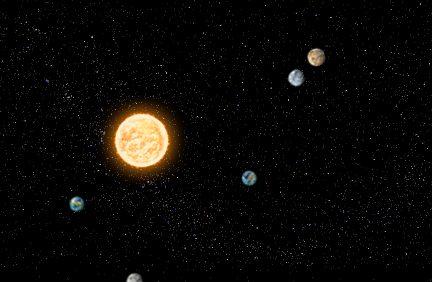
It's time to draw the planets, but first you need to initialize them. Create a new object from the Planet object, transfer to it the orbit, the planet radius and the time of complete rotation around the center of the system (in seconds), as well as additional properties: name, tile and context. The sun, by the way, is also a planet, but with a zero radius of the orbit.
var planets = []; // var mouse = {}; // var globalCenter = new Point(canvas.width / 2, canvas.height / 2); // // globalCenter var orbit = new Orbit(globalCenter.clone(), 0).setProperty({ ctx: ctx, // mouse: mouse // , }, true); // 50 1. . var planet = new Planet(orbit, 50, 1).setProperty({ tile: new Tile(this.ctx, this._resources['sun'], 0, 0, 100, 100), name: 'Sun', ctx: ctx }, true); planets.push(planet); // var names = ['Moon', 'Phobos', 'Deimos', 'Dactyl', 'Linus', 'Io', 'Europa', 'Ganymede', 'Callisto', 'Amalthea', 'Himalia', 'Elara', 'Pasiphae', 'Taurus', 'Sinope', 'Lysithea', 'Carme', 'Ananke', 'Leda', 'Thebe', 'Adrastea', 'Metis', 'Callirrhoe', 'Themisto', '1975', '2000', 'Megaclite', 'Taygete', 'Chaldene', 'Harpalyke']; var tiles = [0, 1, 2, 3, 4, 5, 6, 7, 8, 9, 10, 11]; // var time = 40; shuffle(names); // shuffle(tiles); for (var i = 0; i < 12; ++i) { // 90 , 26 orbit = new Orbit(globalCenter.clone(), 90+i*26).setProperty({ ctx: this.ctx, mouse: this.mouse }, true); planet = new Planet(orbit, 13, time).setProperty({ tile: new Tile(this.ctx, this._resources['planets'], tiles[i]*26, 0, 26, 26), name: names[i], ctx: this.ctx }, true); this.planets.push(planet); time += 20; } Great, now there are planets, but here’s the problem, they still don’t know how to move and don’t know how to draw themselves. Need to fix! I create a function render (lastTime), which takes the time of the last scene update. Renden runs the rendering methods on the planets and keeps track of time. Next, in the Planet prototype, I create a .redner (deltaTime) method that accepts the time elapsed since the last scene update. The function calculates the position of the planet taking into account the time and draws the planet in the updated coordinates. I also create a .showInfo () function for the future to display information about the planet.
Watch
function render(lastTime) { var curTime = new Date(); requestAnimationFrame(function(){ render(curTime); }); ctx.clearRect(0, 0, canvas.width, canvas.height); for (var i = 0, il = planets.length; i < il; ++i) { planets[i].render(curTime - lastTime); } } Planet.prototype = { drawBorder: function() { // var ctx = this.ctx; ctx.beginPath(); ctx.arc(this.pos.x, this.pos.y, this.radius * 1.1, 0, Math.PI * 2, true); ctx.closePath(); ctx.stroke(); }, showInfo: function() { var x = this.pos.x + this.radius * 0.7; // var y = this.pos.y + this.radius * 0.9; // ox oy ctx.fillStyle = '#002244'; ctx.fillRect(x, y, 100, 24); ctx.fillStyle = '#0ff'; ctx.fillText(this.name, x + 50, y + 17); }, render: function(deltaTime) { // r(fi) = radius, r - , fi - this.pos.x = this.orbit.globalCenter.x + this.orbit.radius * Math.cos(this.angle); this.pos.y = this.orbit.globalCenter.y + this.orbit.radius * Math.sin(this.angle); this.angle += this.speed * deltaTime; // if (typeof this.tile !== 'undefined') { // this.tile.draw(this.pos.x - this.radius, this.pos.y - this.radius); } } }; I start, I correct errors, I start again and hurray: the planets are circling around the static Sun.
It remains quite a bit: to display the orbits, the animation of their selection and display information about the planets. Information about the mouse is needed, namely where it moves, whether the buttons on it move, press or press. MouseController will keep track of her behavior over the canvas. Having information about the coordinates of the pointer, you can define a hover event. If the modulus of the difference between the position of the cursor and the center of the orbit is less than a certain value (I have 14px), then this is a hover. Now, if the hover event is present, then a circle is drawn around the center of the orbit with a fatter line, that part of it over which the planet is located is removed and another circle is drawn in this place around, but already around the planet. If there is no hover, then a solid circle is drawn with a thin line.
With the display of the description of the planets, everything is easier. We define over which planet the cursor is located, and we call this planet .showInfo (). There is one thing, the tip to the canvas needs to be drawn last, otherwise I can draw other objects on top of it.
Watch
Orbit.prototype = { draw: function() { var ctx = this.ctx; var hover = this.mouse && Math.abs(mouse.pos.getDis(this.center) - this.radius) < 13; // if (hover) { // ctx.lineWidth = 2; ctx.strokeStyle = 'rgb(0,192,255)'; ctx.beginPath(); // ctx.arc(this.center.x, this.center.y, this.radius, 0, Math.PI * 2, true); ctx.closePath(); ctx.stroke(); if (typeof this.planet !== null) { // // ctx.clearRect(this.planet.pos.x - this.planet.radius, this.planet.pos.y - this.planet.radius, this.planet.radius * 2, this.planet.radius * 2); // this.planet.drawBorder(); } } else { // ctx.lineWidth = 1; ctx.strokeStyle = 'rgba(0,192,255,0.5)'; ctx.beginPath(); ctx.arc(this.center.x, this.center.y, this.radius, 0, Math.PI * 2, true); ctx.closePath(); ctx.stroke(); } } function render(lastTime) { var curTime = new Date(); requestAnimationFrame(function(){ render(curTime); // }); ctx.clearRect(0, 0, canvas.width, canvas.height); // var showInfo = -1; // for (var i = 0, il = planets.length; i < il; ++i) { // planets[i].orbit.draw(); // planets[i].render(curTime - lastTime); // if (Math.abs(planets[i].pos.x-mouse.pos.x) < planets[i].radius // && Math.abs(planets[i].pos.y-mouse.pos.y) < planets[i].radius) { showInfo = i; // , //if (mouse.pressed) { // // planets[i].animate = planets[i].animate ? false : true; //} } } if (showInfo > -1) { // , planets[showInfo].showInfo(); document.body.style.cursor = 'pointer'; } else { document.body.style.cursor = 'default'; } } }; . App. Demo | Download
findings
In theory, the idea where each element is drawn on a certain canvas should provide better performance, and surely this is the case for bulk applications. But in small applications, this rule does not work, where there are no complex animations, there is no need to create many canvases.
The results of profiling on my PC (AMD Athlon64 x2 4600+ 2.4GHz, GeForce 210).
Original:

On LibCanvas (it looks like it has a 60 fps limit):

My implementation:

Thanks for attention.
Source: https://habr.com/ru/post/164899/
All Articles