Automatic analysis of code coverage using OpenCover + buns
Modern approaches to software development place great emphasis on quality control. Now it’s not enough, as before, to just write code, you need to make sure that this code is written correctly.
It is already difficult to find a project in which there are no unit tests. Their use seems to many redundant, because it is a waste of time, which you might as well spend on writing other code and “not, well, I know for sure that everything is right there”. But, as we see, in the long run, tests save more time than they take. Maintenance of the code is facilitated, refactoring becomes safe, the correctness of any changes is monitored. Moreover, the higher the coverage - the stronger the usefulness of the tests.
Accordingly, an important point is the analysis of this coverage itself, and it is desirable line by line to see which parts of the code are not tested and to be able to quickly fix the situation.
')
A detailed analysis of the coverage helps us tool OpenCover. It works with C # code. This is a great open source solution available on github . Documentation is not very much, but quite enough.
So, to start using OpenCover, just download the sources and compile using Visual Studio. OpenCover is a console application, all the necessary options are set by the command line, so it’s not a problem to fasten to any collector, be it MsBuild, Nant, Rake or anything else.
The operation mechanism is interesting - OpenCover is launched with the unit tests run. To be precise, the command to run tests is passed to it as several parameters. (If there are spaces in the argument, then it is fully quoted, for example, “-target:% application%”):
In addition, OpenCover has more arguments governing its work directly. I will cite only those that I use myself; the rest can be found here.
So, we were able to configure and run OpenCover and we even received a report in xml format for many thousands of lines, which contains very detailed information about the coverage of our code. However, there is a problem - it is completely unreadable. And I want to visually see what is covered and how.
Fortunately, the author of OpenCover itself tells us the solution - a tool called ReportGenerator . It is open source, so download the source code, build it, get the executable file and go ahead. Using ReportGenerator is very simple. It is also a console application that accepts several parameters. I will give those that we use, more complete instructions can be found on the project page.
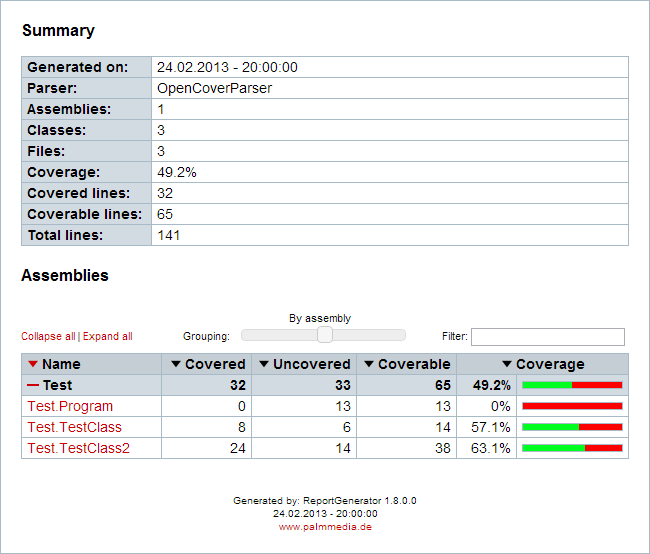
We get just such reports:

A start has been made, the code coverage is analyzed. Further - at your discretion. I, for example, set up our Continuous Integration system so that when the coverage below the required build falls. Given the rigorous attitude to the collapsed builds, it provides a good deal of stable writing of unit tests :)
It is already difficult to find a project in which there are no unit tests. Their use seems to many redundant, because it is a waste of time, which you might as well spend on writing other code and “not, well, I know for sure that everything is right there”. But, as we see, in the long run, tests save more time than they take. Maintenance of the code is facilitated, refactoring becomes safe, the correctness of any changes is monitored. Moreover, the higher the coverage - the stronger the usefulness of the tests.
Accordingly, an important point is the analysis of this coverage itself, and it is desirable line by line to see which parts of the code are not tested and to be able to quickly fix the situation.
')
A detailed analysis of the coverage helps us tool OpenCover. It works with C # code. This is a great open source solution available on github . Documentation is not very much, but quite enough.
So, to start using OpenCover, just download the sources and compile using Visual Studio. OpenCover is a console application, all the necessary options are set by the command line, so it’s not a problem to fasten to any collector, be it MsBuild, Nant, Rake or anything else.
The operation mechanism is interesting - OpenCover is launched with the unit tests run. To be precise, the command to run tests is passed to it as several parameters. (If there are spaces in the argument, then it is fully quoted, for example, “-target:% application%”):
- -target:% application% is the application that needs to be launched (In our case, Gallio.Echo, as a more common example, nunit-console). Important note - the path to the application must be absolute, since we pass it as a parameter, and it will not be searched for in the Path variable.
- -targetdir:% path% - folder in which you want to run% application%
- -targetargs:% args% - parameters passed by% application%
In addition, OpenCover has more arguments governing its work directly. I will cite only those that I use myself; the rest can be found here.
- -output:% path% - indicates where to put the report
- -filter:% filters% - Specifies what to consider when analyzing. Filters have the format + [% assembly%]% type% for included assemblies / types and the same, but with a minus sign at the beginning for exclude. Filters can be set, separated by spaces, in which case the argument is enclosed in quotes. Exclusive filters have priority over inclusive.
- -register - Dynamic registration of the assembly OpenCover.Profiler, necessary for the application to work. It can be omitted if you pre-register manually using regsvr32.exe. If the current user does not have admin rights, use -register: user
- -returntargetcode - Indicates that the errorlevel received by the application specified in the -target parameter should be returned. If you omit this parameter and, for example, a test drops, the application will not stop working. It is necessary if you use coverage analysis in the context of Continuous Integration, since it is possible to combine the analysis with the usual run of unit tests without any problems and avoid their re-launch.
So, we were able to configure and run OpenCover and we even received a report in xml format for many thousands of lines, which contains very detailed information about the coverage of our code. However, there is a problem - it is completely unreadable. And I want to visually see what is covered and how.
Fortunately, the author of OpenCover itself tells us the solution - a tool called ReportGenerator . It is open source, so download the source code, build it, get the executable file and go ahead. Using ReportGenerator is very simple. It is also a console application that accepts several parameters. I will give those that we use, more complete instructions can be found on the project page.
- -reports:% reports% - Separate report source files, if there are several, separate them with a semicolon
- -targetdir:% path% - Specifies where to place the generated reports.
- -reporttypes:% types% - Types of reports generated. We use -reporttypes: Html , we have enough.
We get just such reports:


A start has been made, the code coverage is analyzed. Further - at your discretion. I, for example, set up our Continuous Integration system so that when the coverage below the required build falls. Given the rigorous attitude to the collapsed builds, it provides a good deal of stable writing of unit tests :)
Source: https://habr.com/ru/post/163895/
All Articles