Drawing graphs. Python. Tkinter
This is my first article and I would like to talk about how to write a simple program for drawing graphs of functions.
The article is aimed at beginners!
Let's start with the fact that our function will be:
y = c (x)
Where c (x) is an expression from a single x variable.
Immediately consider her.
We will calculate the value of the function as a function of eval ().
Let's connect the libraries we need.
')
Now you need to draw the axis of coordinates.
To recalculate the function values at different points, I took 16,000 points on the X axis.
For each of them, we consider the value of "y".
Draw ovals with coordinates (x, y, x + 1, y + 1).
Ovals, as you have probably understood, are just points on our chart.
Enumerate these points.
So, we are already able to display the coordinate axes and the graph of the function on the interval from -500 to 500.
But if we introduce a function that is not defined in any of the points being checked, or it contains an error, then our program will crash with an error, this is not great.
In order to fix this, let's improve our code.
And mark our axes.
Now it's done.
The result was a primitive drawing graphs.
The article is aimed at beginners!
Let's start with the fact that our function will be:
y = c (x)
Where c (x) is an expression from a single x variable.
Immediately consider her.
f = input('f(x):') We will calculate the value of the function as a function of eval ().
Let's connect the libraries we need.
')
from math import * from tkinter import * f = input('f(x):') Now you need to draw the axis of coordinates.
from math import * from tkinter import * f = input('f(x):') root = Tk() canv = Canvas(root, width = 1000, height = 1000, bg = "lightblue", cursor = "pencil") canv.create_line(500,1000,500,0,width=2,arrow=LAST) canv.create_line(0,500,1000,500,width=2,arrow=LAST) canv.pack() root.mainloop() To recalculate the function values at different points, I took 16,000 points on the X axis.
For each of them, we consider the value of "y".
Draw ovals with coordinates (x, y, x + 1, y + 1).
Ovals, as you have probably understood, are just points on our chart.
Enumerate these points.
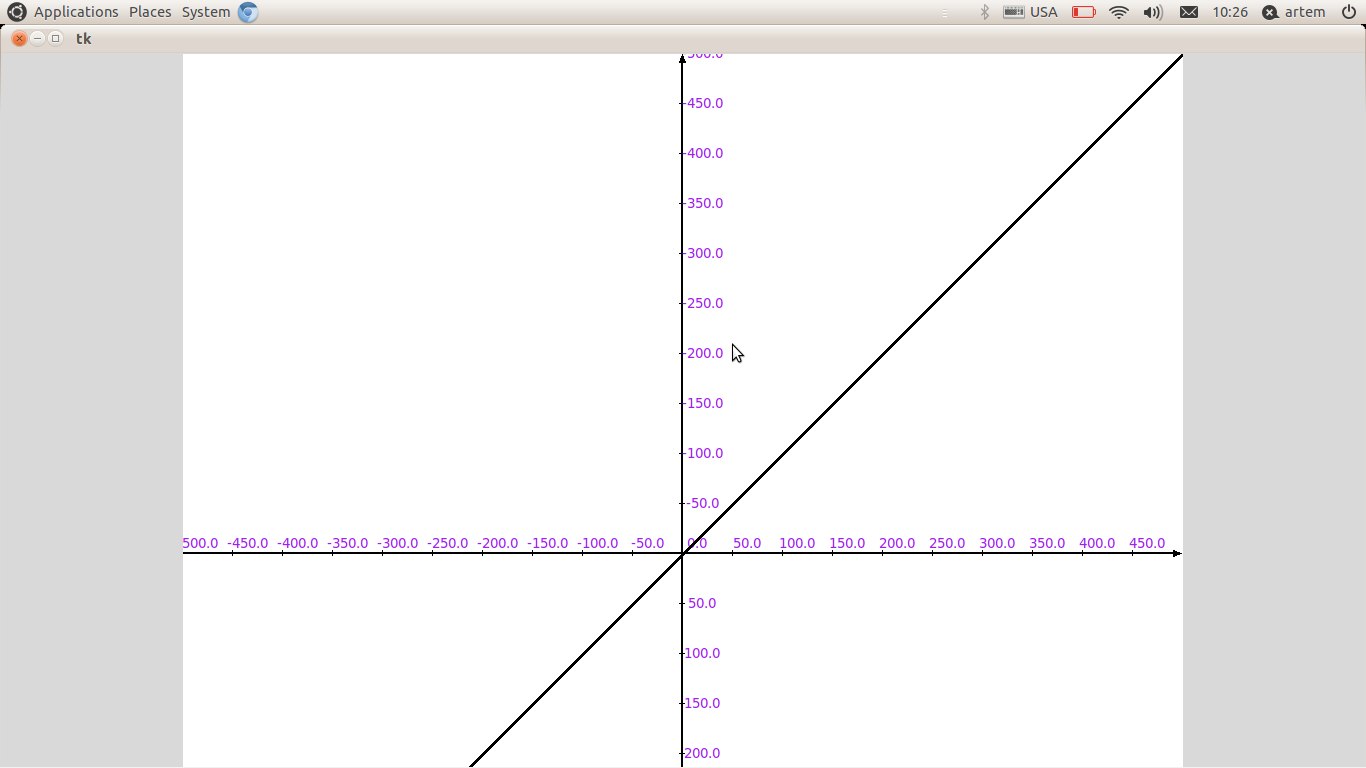
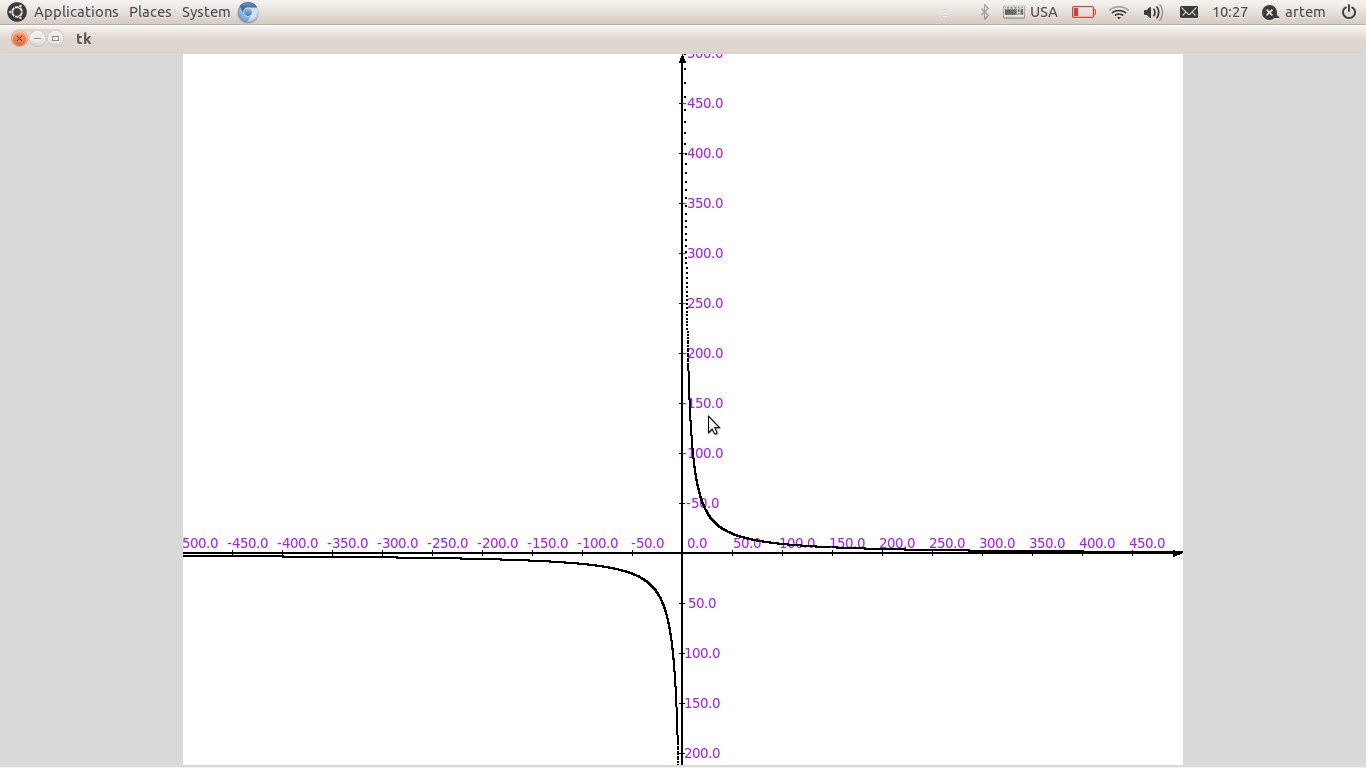
from math import * from tkinter import * f = input('f(x):') root = Tk() canv = Canvas(root, width = 1000, height = 1000, bg = "white") canv.create_line(500,1000,500,0,width=2,arrow=LAST) canv.create_line(0,500,1000,500,width=2,arrow=LAST) First_x = -500; for i in range(16000): x = First_x + (1 / 16) * i new_f = f.replace('x', str(x)) y = -eval(new_f) + 500 x += 500 canv.create_oval(x, y, x + 1, y + 1, fill = 'black') canv.pack() root.mainloop() So, we are already able to display the coordinate axes and the graph of the function on the interval from -500 to 500.
But if we introduce a function that is not defined in any of the points being checked, or it contains an error, then our program will crash with an error, this is not great.
In order to fix this, let's improve our code.
And mark our axes.
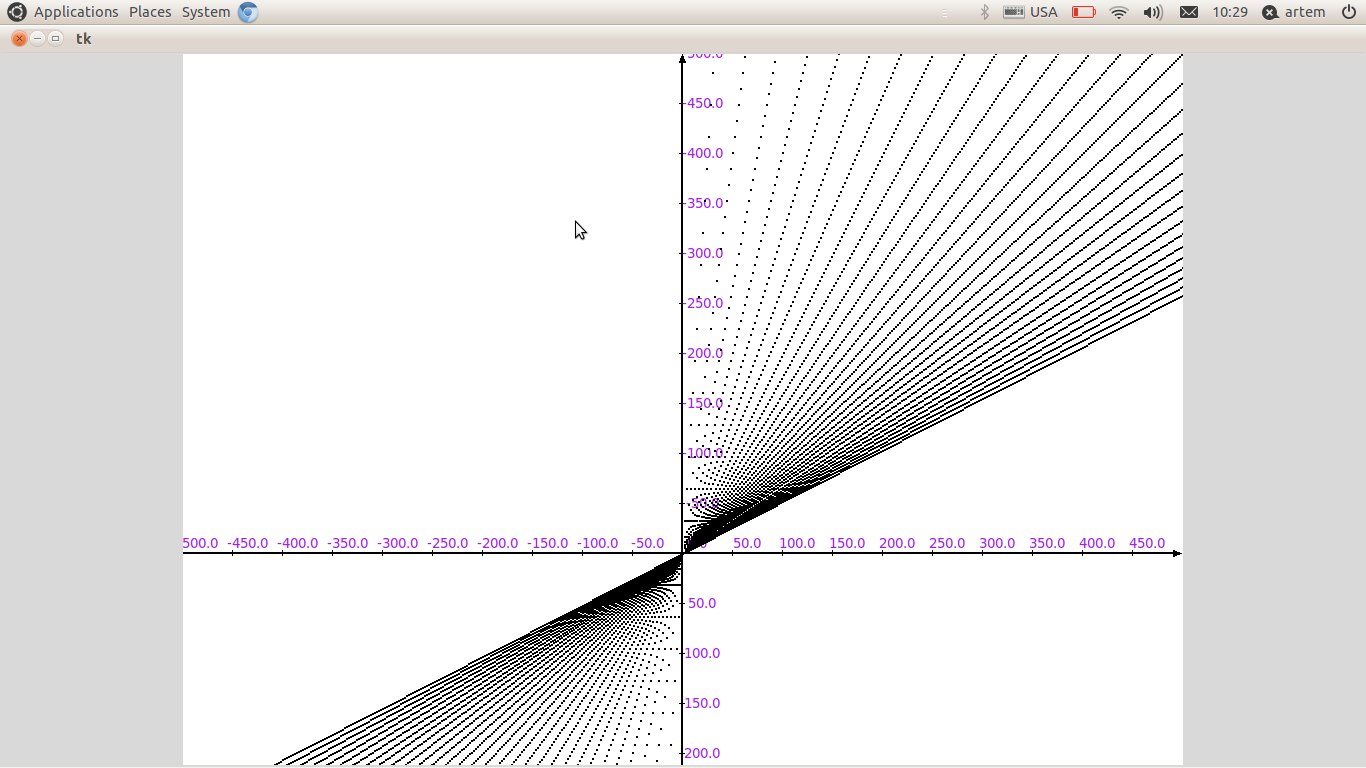
from math import * from tkinter import * f = input('f(x):') root = Tk() canv = Canvas(root, width = 1000, height = 1000, bg = "white") canv.create_line(500,1000,500,0,width=2,arrow=LAST) canv.create_line(0,500,1000,500,width=2,arrow=LAST) First_x = -500; for i in range(16000): if (i % 800 == 0): k = First_x + (1 / 16) * i canv.create_line(k + 500, -3 + 500, k + 500, 3 + 500, width = 0.5, fill = 'black') canv.create_text(k + 515, -10 + 500, text = str(k), fill="purple", font=("Helvectica", "10")) if (k != 0): canv.create_line(-3 + 500, k + 500, 3 + 500, k + 500, width = 0.5, fill = 'black') canv.create_text(20 + 500, k + 500, text = str(k), fill="purple", font=("Helvectica", "10")) try: x = First_x + (1 / 16) * i new_f = f.replace('x', str(x)) y = -eval(new_f) + 500 x += 500 canv.create_oval(x, y, x + 1, y + 1, fill = 'black') except: pass canv.pack() root.mainloop() Now it's done.
The result was a primitive drawing graphs.
Source: https://habr.com/ru/post/163395/
All Articles