Analysis of statistics in free-to-play games: analytics tools
The key to success in developing free-to-play games is the analysis of player behavior and constant tuning of game functionality based on statistics. Collect statistics - this is the floor of the case. But how to turn a mountain of raw data into information?
In my last article I listed the main indicators by which you can track the success of the game. In the second part of the cycle, I will review the basic tools that will help turn the data into a guide to action.
')
The main tool that helps transform data into information is player segmentation. Segmentation is the allocation of user groups, which are characterized by a common feature, and work with application indicators within these groups. Simply put, segment selection is the creation of a search filter that allows you to find all users with specified parameters: by date of registration, by demographic characteristics, by the source of switching to the application, by certain actions of users, etc.
If you are developing games, and your system for collecting and analyzing statistics does not support player segmentation, then you should not use it at all. Segmentation underlies all other analysis tools. In order to be able to analyze user segments, you need to make sure in advance that the necessary parameters of these users are logged in the application in the correct way.
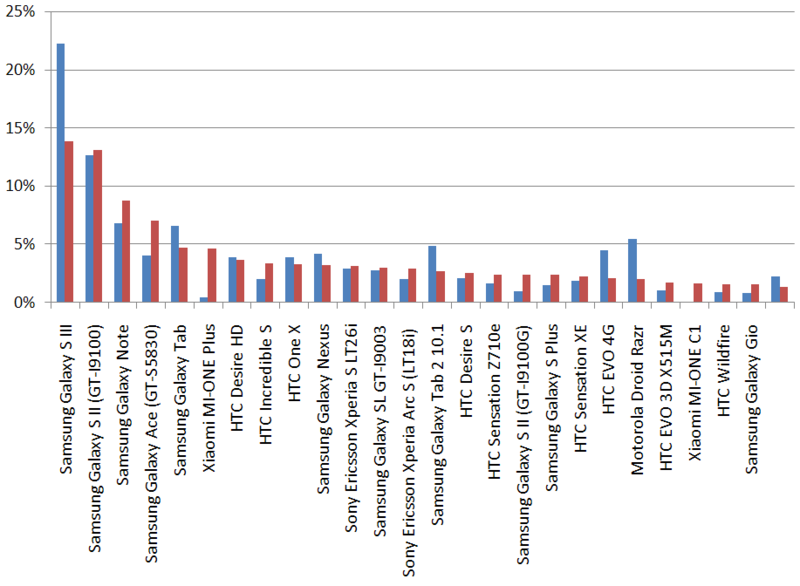
The average in the game as a whole can vary greatly from the same indicators that are measured for specific segments. This means that decisions about improvements in the game must be made taking into account different segments. I will give a simple example. Consider the top 25 devices on which players launch the Treasures of Montezuma 3 game for Android. We will build a segment of players who have made a purchase or used an advertising offer. Now let's see how the positions of devices in the top have changed relative to this segment. From the graph below it is clear that there are models of devices on which the game is installed frequently, but it rarely comes to purchase. And vice versa: it would seem that the device does not occupy the first positions, but due to the high conversion into paying, it is worth paying more attention to it when checking the game. It is also worth exploring devices with extremely low conversion: they may have technical problems that hinder the progress of players.
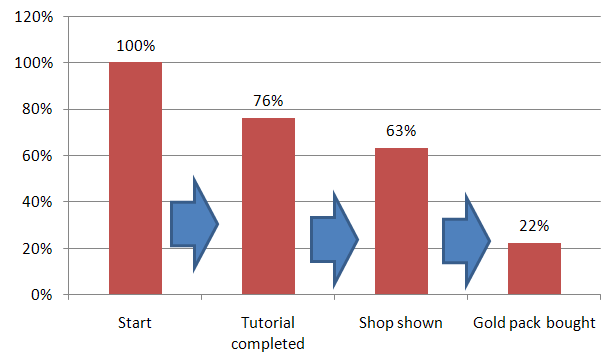
"Funnels" are designed to analyze the sequence of steps that players have performed, moving towards some chosen goal within the game. For example, we are interested in how many percent of players decide to buy as a result of the following sequence of steps in the game: the player went into the game, finished the tutorial, opened the store, bought a local currency package. Among the players who have passed the first step, those who have also passed the second, and so on are selected (the diagram below is fictional). As a result of considering this funnel, we get a conversion of new players into paying ones, with respect to our chosen sequence of steps. Having such a “funnel”, you can optimize each step so that as many players as possible go through all the stages and fulfill their goals. If at a certain step a lot of players are lost, you need to break it up into smaller steps and build a similar “funnel” with added steps.
Of course, in order to build "funnels", you need to take care in advance that all steps that are involved in the analysis are correctly logged in the game. In addition, you need to remember that when building a "funnel" the order of steps is important: if you change the order of steps, you will get a completely different result. Some analysis systems allow you to set the minimum and maximum time that must elapse between steps. It is important that the analysis system allows you to build "funnels" on the already collected data. If, when changing a funnel, it is necessary to wait until fresh data has accumulated, then it is better to abandon such an analysis system, since the data obtained in different periods of time may differ significantly, and comparing them may lead to errors.
How to find out if your product gets better over time? Let's say you made certain changes to the product and saw an increase in the number of users per day. But how to understand what really led to this growth? Latest innovations, marketing campaign that worked effectively or season? A cohort analysis will help in understanding this, which allows us to separate the overall growth indicators from those related to user behavior (new and current).
The cohort analysis was born in medicine and allows you to measure user interaction with the product over time. Cohorts are groups of people selected for a common basis. For example, people with the same year of birth, weight category, etc. In games, the most popular use of cohort analysis is related to the measurement of the retention rate of players.
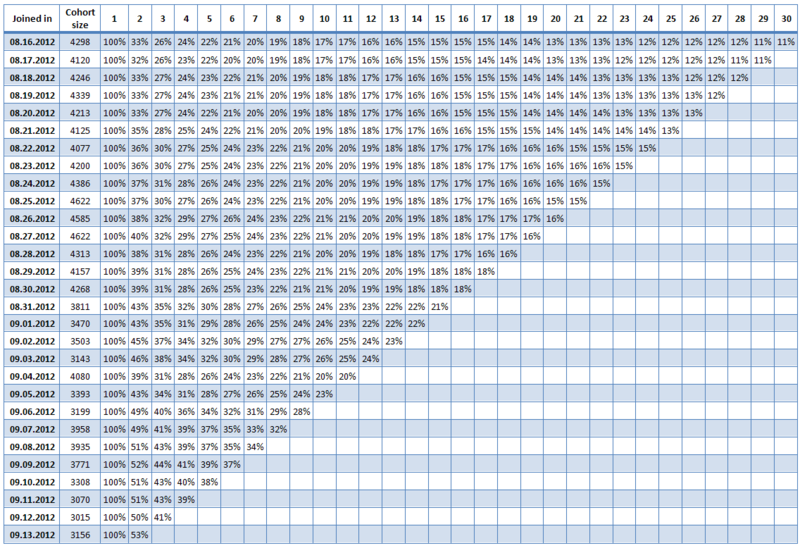
Let us consider the calculation of the return of players in the first month after installing the game. We divide all players into groups by date of installation of the game. For the players of each group, we will record how many of them entered the game on the 2nd, 3rd, ... 30th day after installation. It is clear that the number of them by the 30th day will decrease, but the rate of decrease is what will interest you and what needs to be compared for different cohorts of players. As a result, we get the table shown below (the data in the table is fictional).
If a change was introduced into the game, you can analyze how it affected the recurrence (and therefore involvement) of the players. Similar tables can be built for longer periods — for example, by forming cohorts of players who set up a game in given weeks or months. Cohort analysis, as a tool, can be used to track any indicators over time. In our example, we considered the number of players who entered the game on a certain day, and could analyze the time spent in the game, money spent, currency earned, points earned, tasks completed, the number of invitations of friends, etc. A cohort analysis can be performed for individual player segments and compare the results.
A / B tests are used to check how effective certain changes in an application are. Its essence is as follows. The application contains N variants of some functionality (for example, buttons of different colors, different text in a window, different prices for in-game items, etc.). All users are as evenly divided into N equal non-intersecting groups. Each group is offered its own version of the functional, and then the indicators for each group are analyzed and compared. As a result, the “winning option” is chosen, which is already fully embedded in the application.
What gives this tool? During the development of the game a lot of ideas and options for the implementation of the same game features are born. Sometimes it is faster to implement two options at once, and then check on real players. Moreover, it often happens that the A / B test series reveals the most effective combination of solutions that it was impossible to guess and guess during the development process. There are a lot of examples when such “micro-optimizations” made it possible to improve the outcome indicators of applications, services, games, etc. several times. One of my favorite examples is the story of Dan Siroker , founder of the Optimizely service, about how the A / B tests helped to win the presidential election.
There are several rules to follow when conducting A / B tests.
After segmentation of players by certain parameters, it is sometimes useful to find out who these people really are. If you log enough information in the game about the players' behavior and their parameters, you can select the logs of random players and try to write their history: how they play, what difficulties they experience, what motivates them to buy, what days / hours they usually play, how much time to pass when they leave the game. Doing it manually for a long time, but sometimes it is useful. You can use more sophisticated methods that will reveal exactly the characteristic features of player segments, but this is a topic for a separate article. For starters, you can process several players from different segments and hang portraits on their walls (fictional or real, if the game is integrated with social networks). The development will go more fun.
In games, as in the real world, shopping carts can be analyzed, and often this provides useful information. This allows you to identify which products are usually bought together. You can use this information for a variety of purposes. To bring the most popular products to a prominent place, to offer to buy something in addition to the already made purchases, to increase the visibility of those products that are poorly bought, or to refuse them, to replenish the range with new products, given what is in demand.
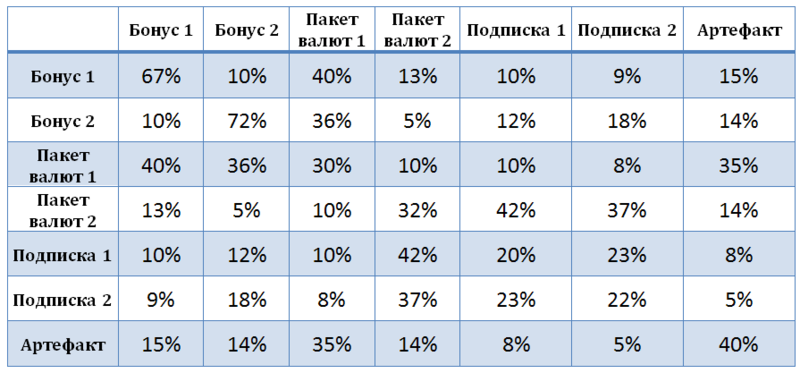
Consider a simple fictional example. Suppose the game has the following set of products available for purchase: bonuses 1 and 2, currency packs 1 and 2, subscriptions 1 and 2, artifact. Fill in the table as follows: on the diagonal - the percentage of players who bought the corresponding product more than once. In the remaining cells - the percentage of players who have bought both products at least once (vertically and horizontally). In the example below, it turns out that bonuses 1 and 2 and the artifact more often than other products are bought again in the game, you can hang on them the label of "popular products". If you look at the third row in the table, it turns out that currency pack 1 is often combined with bonus 1 and 2 and with an artifact, while currency pack 2 is often bought in conjunction with subscriptions. From this it is possible, for example, to conclude that the game has at least two segments of players: the first is those who like to use bonuses and artifacts, the second is those who buy the more expensive second package of currencies and spend it on subscription .
In the course of the analysis it will become clear that different segments of players have different baskets. Or it may turn out that some segments of players cannot find suitable goods for themselves and leave the game without buying anything. So - you need to work on a range of products.
So, in my two articles I briefly told about the main indicators that are tracked in games, as well as about the tools that should be present in the arsenal of any analyst.
Now you probably can not wait to see how all this is used in practice. In the next article (it will be released in 2013) I will try to answer the question, which analytical services should I use, so that the listed indicators and tools are always at hand. Immediately I will warn that it will be about the services of collecting and analyzing statistics in mobile applications.
By the way, if you have any suggestions about which services are worth mentioning - write in the comments!
In my last article I listed the main indicators by which you can track the success of the game. In the second part of the cycle, I will review the basic tools that will help turn the data into a guide to action.
Segmentation
')
The main tool that helps transform data into information is player segmentation. Segmentation is the allocation of user groups, which are characterized by a common feature, and work with application indicators within these groups. Simply put, segment selection is the creation of a search filter that allows you to find all users with specified parameters: by date of registration, by demographic characteristics, by the source of switching to the application, by certain actions of users, etc.
If you are developing games, and your system for collecting and analyzing statistics does not support player segmentation, then you should not use it at all. Segmentation underlies all other analysis tools. In order to be able to analyze user segments, you need to make sure in advance that the necessary parameters of these users are logged in the application in the correct way.
The average in the game as a whole can vary greatly from the same indicators that are measured for specific segments. This means that decisions about improvements in the game must be made taking into account different segments. I will give a simple example. Consider the top 25 devices on which players launch the Treasures of Montezuma 3 game for Android. We will build a segment of players who have made a purchase or used an advertising offer. Now let's see how the positions of devices in the top have changed relative to this segment. From the graph below it is clear that there are models of devices on which the game is installed frequently, but it rarely comes to purchase. And vice versa: it would seem that the device does not occupy the first positions, but due to the high conversion into paying, it is worth paying more attention to it when checking the game. It is also worth exploring devices with extremely low conversion: they may have technical problems that hinder the progress of players.
Conversion Analysis (or "Funnels")
"Funnels" are designed to analyze the sequence of steps that players have performed, moving towards some chosen goal within the game. For example, we are interested in how many percent of players decide to buy as a result of the following sequence of steps in the game: the player went into the game, finished the tutorial, opened the store, bought a local currency package. Among the players who have passed the first step, those who have also passed the second, and so on are selected (the diagram below is fictional). As a result of considering this funnel, we get a conversion of new players into paying ones, with respect to our chosen sequence of steps. Having such a “funnel”, you can optimize each step so that as many players as possible go through all the stages and fulfill their goals. If at a certain step a lot of players are lost, you need to break it up into smaller steps and build a similar “funnel” with added steps.
Of course, in order to build "funnels", you need to take care in advance that all steps that are involved in the analysis are correctly logged in the game. In addition, you need to remember that when building a "funnel" the order of steps is important: if you change the order of steps, you will get a completely different result. Some analysis systems allow you to set the minimum and maximum time that must elapse between steps. It is important that the analysis system allows you to build "funnels" on the already collected data. If, when changing a funnel, it is necessary to wait until fresh data has accumulated, then it is better to abandon such an analysis system, since the data obtained in different periods of time may differ significantly, and comparing them may lead to errors.
Cohort analysis
How to find out if your product gets better over time? Let's say you made certain changes to the product and saw an increase in the number of users per day. But how to understand what really led to this growth? Latest innovations, marketing campaign that worked effectively or season? A cohort analysis will help in understanding this, which allows us to separate the overall growth indicators from those related to user behavior (new and current).
The cohort analysis was born in medicine and allows you to measure user interaction with the product over time. Cohorts are groups of people selected for a common basis. For example, people with the same year of birth, weight category, etc. In games, the most popular use of cohort analysis is related to the measurement of the retention rate of players.
Let us consider the calculation of the return of players in the first month after installing the game. We divide all players into groups by date of installation of the game. For the players of each group, we will record how many of them entered the game on the 2nd, 3rd, ... 30th day after installation. It is clear that the number of them by the 30th day will decrease, but the rate of decrease is what will interest you and what needs to be compared for different cohorts of players. As a result, we get the table shown below (the data in the table is fictional).
If a change was introduced into the game, you can analyze how it affected the recurrence (and therefore involvement) of the players. Similar tables can be built for longer periods — for example, by forming cohorts of players who set up a game in given weeks or months. Cohort analysis, as a tool, can be used to track any indicators over time. In our example, we considered the number of players who entered the game on a certain day, and could analyze the time spent in the game, money spent, currency earned, points earned, tasks completed, the number of invitations of friends, etc. A cohort analysis can be performed for individual player segments and compare the results.
A / B testing
A / B tests are used to check how effective certain changes in an application are. Its essence is as follows. The application contains N variants of some functionality (for example, buttons of different colors, different text in a window, different prices for in-game items, etc.). All users are as evenly divided into N equal non-intersecting groups. Each group is offered its own version of the functional, and then the indicators for each group are analyzed and compared. As a result, the “winning option” is chosen, which is already fully embedded in the application.
What gives this tool? During the development of the game a lot of ideas and options for the implementation of the same game features are born. Sometimes it is faster to implement two options at once, and then check on real players. Moreover, it often happens that the A / B test series reveals the most effective combination of solutions that it was impossible to guess and guess during the development process. There are a lot of examples when such “micro-optimizations” made it possible to improve the outcome indicators of applications, services, games, etc. several times. One of my favorite examples is the story of Dan Siroker , founder of the Optimizely service, about how the A / B tests helped to win the presidential election.
There are several rules to follow when conducting A / B tests.
- Before testing, it is important to conduct A / A tests when people are divided into groups, but each group is given the same option. If the indicators for all groups coincided, then the groups were formed correctly and the results of the A / B tests will be correct.
- A / B tests must run at the same time for all groups, since all players must be on the same level as possible. After all, the game indicators are very sensitive to the time of year, days of the week, traffic sources, promotions and even to the weather.
- A / B testing needs atomic changes. If in the functional variants there will be not one difference, but a whole set, in the end it will be impossible to say with certainty which of these changes influenced the result.
Characters
After segmentation of players by certain parameters, it is sometimes useful to find out who these people really are. If you log enough information in the game about the players' behavior and their parameters, you can select the logs of random players and try to write their history: how they play, what difficulties they experience, what motivates them to buy, what days / hours they usually play, how much time to pass when they leave the game. Doing it manually for a long time, but sometimes it is useful. You can use more sophisticated methods that will reveal exactly the characteristic features of player segments, but this is a topic for a separate article. For starters, you can process several players from different segments and hang portraits on their walls (fictional or real, if the game is integrated with social networks). The development will go more fun.
Consumer Basket Analysis
In games, as in the real world, shopping carts can be analyzed, and often this provides useful information. This allows you to identify which products are usually bought together. You can use this information for a variety of purposes. To bring the most popular products to a prominent place, to offer to buy something in addition to the already made purchases, to increase the visibility of those products that are poorly bought, or to refuse them, to replenish the range with new products, given what is in demand.
Consider a simple fictional example. Suppose the game has the following set of products available for purchase: bonuses 1 and 2, currency packs 1 and 2, subscriptions 1 and 2, artifact. Fill in the table as follows: on the diagonal - the percentage of players who bought the corresponding product more than once. In the remaining cells - the percentage of players who have bought both products at least once (vertically and horizontally). In the example below, it turns out that bonuses 1 and 2 and the artifact more often than other products are bought again in the game, you can hang on them the label of "popular products". If you look at the third row in the table, it turns out that currency pack 1 is often combined with bonus 1 and 2 and with an artifact, while currency pack 2 is often bought in conjunction with subscriptions. From this it is possible, for example, to conclude that the game has at least two segments of players: the first is those who like to use bonuses and artifacts, the second is those who buy the more expensive second package of currencies and spend it on subscription .
In the course of the analysis it will become clear that different segments of players have different baskets. Or it may turn out that some segments of players cannot find suitable goods for themselves and leave the game without buying anything. So - you need to work on a range of products.
Finally
So, in my two articles I briefly told about the main indicators that are tracked in games, as well as about the tools that should be present in the arsenal of any analyst.
Now you probably can not wait to see how all this is used in practice. In the next article (it will be released in 2013) I will try to answer the question, which analytical services should I use, so that the listed indicators and tools are always at hand. Immediately I will warn that it will be about the services of collecting and analyzing statistics in mobile applications.
By the way, if you have any suggestions about which services are worth mentioning - write in the comments!
Source: https://habr.com/ru/post/162739/
All Articles