Systematics of prokaryotes - distant relatives
In the summer I planned an experiment and wrote an article Using UML for an experiment on the evolutionary systematics of prokaryotes, and indirectly about the psychology of scientists . The rough processing results were already ready by the end of the summer (thanks to mktums for the help).
Now there was a pause, and I finished off this topic, and present the results.
')
(I will repeat something from the previous article in order not to force new readers to read it)
The main criticism of the article Interesting results about the evolutionary systematics of prokaryotes, or “many-species origins”, consisted in the following claim “ One gene cannot be considered as a measure ”. With this, I fully agree, and this experiment fixes this fully.
Some numbers. Now in the NCBI there are about 2,000 genomes of bacteria (3,723 loci). In preparation for the experiment, I isolated all the tRNAs that are labeled this way. They turned out more than 40 thousand unique variations. But alas, there are a lot of mistakes among them (about 50%, see previous articles, where it was discussed in detail).
But I thought that you can skip the stage of full error correction. How to do it? I sorted these tRNAs by length and by the presence of the end of the CCA at the end of the sequence. It must be said that the CCA sequence is obligatory for any tRNA, and the length can be from 74 to 96 nucleotides.
There are many miracles in NCBI up to tRNA from one nucleotide, or more than 1300 :) (you can’t tell without a smile). Therefore, I removed the sequences that are up to 70 and over 100 in length, as well as those that do not end in CCA.
There are about 20,000 of them. These are the most likely tRNAs that do not contain errors from the NCBI. With the remaining half of the tRNA - you can figure it out later.
In fact, for a planned experiment, it makes no difference whether this particular sequence of 70–100 nucleotides in length contains errors or not. Why? Since I am going to double-check the genomes of 2000 bacteria, are there really such sequences - the errors will be excluded. And tRNA is actually whether or not this is the second thing. The main thing is that different organisms coincide significant portions of DNA. The coincidence of the sequence length of 70-100 in the genomes is far from accidental.
Therefore, what am I doing now? I take these 20,000 tRNAs and find which bacteria they are present in. If the sequence is present in only one organism, this is not interesting. And most likely this is an erroneous sequence. And thus a substantial percentage of errors is eliminated.
If there is a sequence in more than one organism, this is one association (connection) between two organisms.
The first article made an important conclusion that
I was also advised to display the graph using Graphviz, which I did. But Graphviz hangs when the number of links in the graph is more than 1000. And I have a total graph of 6172 links. Therefore, here I show only a small fragment for clarity. And I give a link to a graph of almost 1000 links.
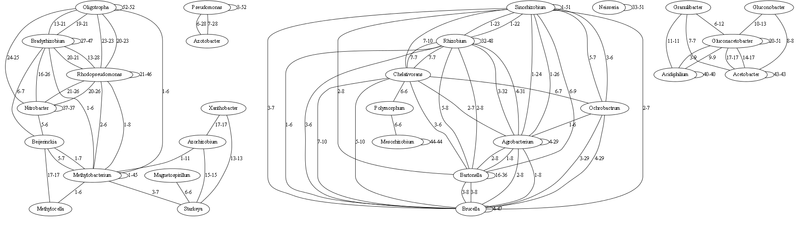
Here is the graph with the strongest bonds (links to 5 identical tRNAs are omitted, inclusive)
Each link is characterized by a minimum-maximum number of coincident (100% identical) tRNA genes. Relationship of a genus with oneself means the number of identical tRNAs within this genus (i.e., how species differ).
In fact, all this must still be visually processed, so that it would be possible to visually embrace all this set. On the column with 1000 connections there are many genera that are not connected with anyone - but if you display weaker connections with up to 5 identical tRNAs, then you can see distant relatives. (I am thinking of doing this as the next step, if you are willing to help, write).
In fact, on this basis, much coincides according to the current classification. The number of identical tRNAs is well illustrated by the range of genera from each other, the smaller the number of identical tRNAs, the more ancient the ancestor. Those genera that have few connections are the most ancient (as they are sequenced now, and their population is currently represented by separate species). Analyzing them you can build a fairly accurate initial evolution process.
upd. Removed from the graph two-way communication (littered image). The total number of links was reduced to 4551. This allowed to display a larger graph:
Download the image here (11.2 MB). Here is the graph with the strongest bonds (links to 3 identical tRNAs are omitted, inclusive)
Then connections (intermediate types) between two huge domains are visible (stand out in the image, presumably correspond to Beta and Gamma proteobacteria), and other details. How much this corresponds to the current classification should be compared, but there is something to think about (just the detailing is such that for sure there is something that did not fall into the current scientific classification).
upd2 Using yEd Graph Editor it turned out to display the full graph. Below is a mini picture.
The image turns out badly because of the links are not visible details, so below the file in the format yEd Graph Editor, there at least you can enlarge, move and see. If someone becomes interested and makes a more visible graph - I will say thanks :).
Graph "Systematics of prokaryotes (505 genera and 4548 connections between them)"
Now there was a pause, and I finished off this topic, and present the results.
')
Method
(I will repeat something from the previous article in order not to force new readers to read it)
The main criticism of the article Interesting results about the evolutionary systematics of prokaryotes, or “many-species origins”, consisted in the following claim “ One gene cannot be considered as a measure ”. With this, I fully agree, and this experiment fixes this fully.
Some numbers. Now in the NCBI there are about 2,000 genomes of bacteria (3,723 loci). In preparation for the experiment, I isolated all the tRNAs that are labeled this way. They turned out more than 40 thousand unique variations. But alas, there are a lot of mistakes among them (about 50%, see previous articles, where it was discussed in detail).
But I thought that you can skip the stage of full error correction. How to do it? I sorted these tRNAs by length and by the presence of the end of the CCA at the end of the sequence. It must be said that the CCA sequence is obligatory for any tRNA, and the length can be from 74 to 96 nucleotides.
There are many miracles in NCBI up to tRNA from one nucleotide, or more than 1300 :) (you can’t tell without a smile). Therefore, I removed the sequences that are up to 70 and over 100 in length, as well as those that do not end in CCA.
There are about 20,000 of them. These are the most likely tRNAs that do not contain errors from the NCBI. With the remaining half of the tRNA - you can figure it out later.
In fact, for a planned experiment, it makes no difference whether this particular sequence of 70–100 nucleotides in length contains errors or not. Why? Since I am going to double-check the genomes of 2000 bacteria, are there really such sequences - the errors will be excluded. And tRNA is actually whether or not this is the second thing. The main thing is that different organisms coincide significant portions of DNA. The coincidence of the sequence length of 70-100 in the genomes is far from accidental.
Therefore, what am I doing now? I take these 20,000 tRNAs and find which bacteria they are present in. If the sequence is present in only one organism, this is not interesting. And most likely this is an erroneous sequence. And thus a substantial percentage of errors is eliminated.
If there is a sequence in more than one organism, this is one association (connection) between two organisms.
results
The first article made an important conclusion that
The multi-species origin greatly confuses the evolutionary picture, but nothing can be done about it - such is the complexity of speciation, and we only need to reflect them most accurately in conditions when not all species are known.
And therefore, to adequately describe, we need not phylogenetic trees. At a minimum, one can speak of genital trees with two parents (for averaging), and in general, a graph.
I was also advised to display the graph using Graphviz, which I did. But Graphviz hangs when the number of links in the graph is more than 1000. And I have a total graph of 6172 links. Therefore, here I show only a small fragment for clarity. And I give a link to a graph of almost 1000 links.
Here is the graph with the strongest bonds (links to 5 identical tRNAs are omitted, inclusive)
Each link is characterized by a minimum-maximum number of coincident (100% identical) tRNA genes. Relationship of a genus with oneself means the number of identical tRNAs within this genus (i.e., how species differ).
Some conclusions
In fact, all this must still be visually processed, so that it would be possible to visually embrace all this set. On the column with 1000 connections there are many genera that are not connected with anyone - but if you display weaker connections with up to 5 identical tRNAs, then you can see distant relatives. (I am thinking of doing this as the next step, if you are willing to help, write).
In fact, on this basis, much coincides according to the current classification. The number of identical tRNAs is well illustrated by the range of genera from each other, the smaller the number of identical tRNAs, the more ancient the ancestor. Those genera that have few connections are the most ancient (as they are sequenced now, and their population is currently represented by separate species). Analyzing them you can build a fairly accurate initial evolution process.
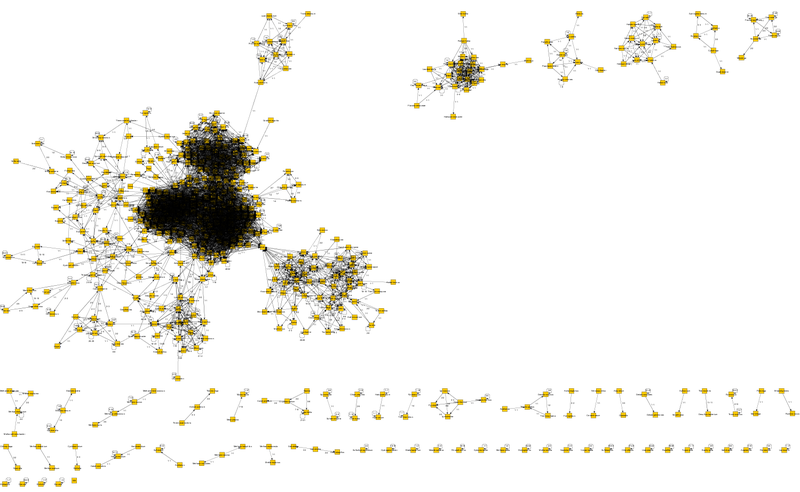
upd. Removed from the graph two-way communication (littered image). The total number of links was reduced to 4551. This allowed to display a larger graph:
Download the image here (11.2 MB). Here is the graph with the strongest bonds (links to 3 identical tRNAs are omitted, inclusive)
Then connections (intermediate types) between two huge domains are visible (stand out in the image, presumably correspond to Beta and Gamma proteobacteria), and other details. How much this corresponds to the current classification should be compared, but there is something to think about (just the detailing is such that for sure there is something that did not fall into the current scientific classification).
upd2 Using yEd Graph Editor it turned out to display the full graph. Below is a mini picture.
The image turns out badly because of the links are not visible details, so below the file in the format yEd Graph Editor, there at least you can enlarge, move and see. If someone becomes interested and makes a more visible graph - I will say thanks :).
Graph "Systematics of prokaryotes (505 genera and 4548 connections between them)"
Source: https://habr.com/ru/post/162729/
All Articles