Language R to help habra-extra
The following topic inspired me to write this article: In search of the perfect post, or the riddle of Habr . The fact is that after acquaintance with the language R, I look askance at any attempts, to calculate something in Excel. But I must admit that I met R only a week ago.
Purpose: To collect data from the beloved HabraHabr by means of the R language and to carry out, in fact, what the R language was created for, namely: statistical analysis.
So, after reading this topic you will learn:
')
It is expected that the reader is self-sufficient enough to become familiar with the basic structures of the language. For this, the links at the end of the article are better suited.
We will need the following resources:
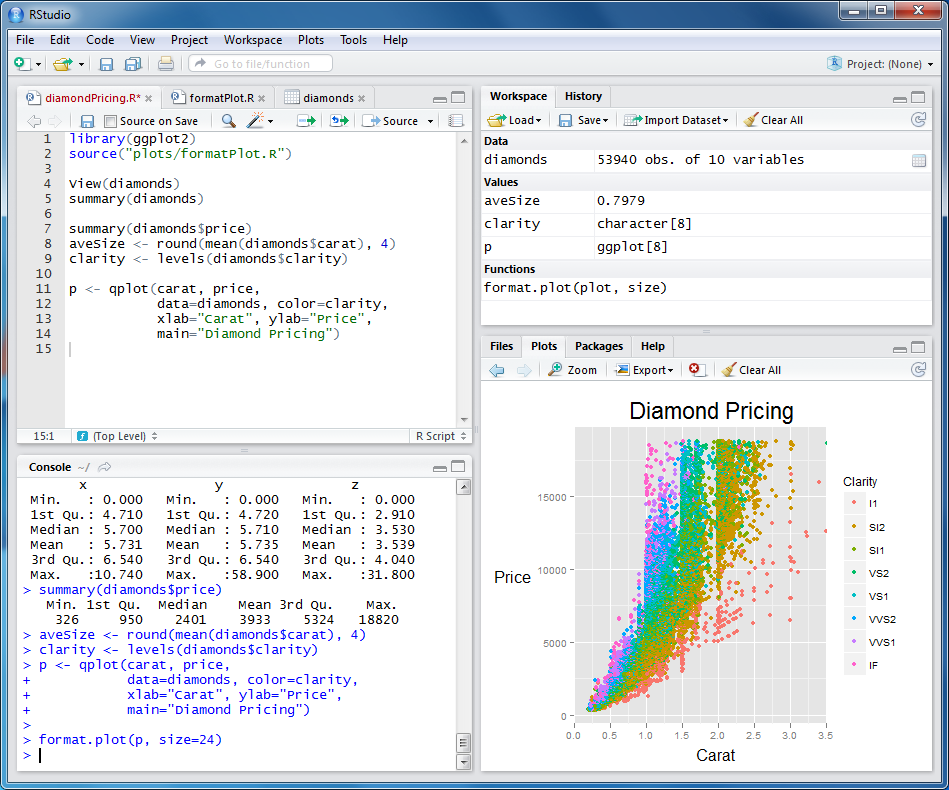
After installation, you should see something like this:
In the right bottom panel on the Packages tab, you can find a list of installed packages. We will need to additionally install the following:
Click “Install Packages”, select the ones you need, and then select them with a check mark to load them into the current environment.
To obtain a DOM document object obtained from the Internet, it is enough to execute the following lines:
Pay attention to the transmitted cookies. If you want to repeat the experiment, then you will need to substitute your cookies, which your browser receives after logging in to the site. Next we need to get the data we are interested in, namely:
Not giving in particular in details I will give the code immediately:
Here we used the search for elements and attributes using xpath.
Further, it is highly recommended to generate data.frame from the obtained data - this is an analogue of the database tables. It will be possible to make requests of different levels of complexity. Sometimes you wonder how elegant you can do this or that thing in R.
After the data.frame is formed, it will be necessary to correct the received data: convert the lines into numbers, get the real date in the normal format, etc. We do it this way:
It is also useful to add additional fields that are calculated from those already received:
Here we all well-known messages of the type “Total 35: ↑ 29 and ↓ 6” converted into an array of data on how many actions were taken at all, how many advantages there were and how many minuses there were.
At this point, it can be said that all data has been received and converted to a format ready for analysis. I designed the code above as a ready-to-use function. At the end of the article you can find a link to the source.
But the attentive reader has already noticed that in this way, we obtained data for only one page in order to get for a whole series. To get the data for the whole list of pages, the following function was written:
Here we use the system function Sys.sleep in order not to accidentally arrange the habraeffect itself :)
This function is proposed to use as follows:
Thus we download all pages from 10 to 100 with a pause of 5 seconds. Pages to 10 are not interesting to us, since the estimates are not visible there yet. After a few minutes of waiting, all our data is in the posts variable. I recommend to save them right away, so as not to disturb Habr every time! It is done this way:
And we read as follows:
Hooray! We learned to get statistical data from the habr and save them locally for the next analysis!
This section I will leave unsaid. I suggest the reader to play with the data himself and get his own conclusions. For example, try to analyze the dependence of mood plus and minus depending on the day of the week. I will cite only 2 interesting conclusions that I made.
This is seen in the following graph. Notice how much the "cloud" of the minuses is more even and wider than the spread of the pros. The correlation of pluses from the number of views is much stronger than for minuses. In other words: plus without thinking, and minus the cause!
(I apologize for the inscriptions on the graphs: until I figured out how to display them correctly in Russian)
This statement in the post mentioned was used as a given, but I wanted to see this in reality. To do this, it is enough to calculate the average share of benefits to the total number of actions, the same for minuses and divide the second into the first. If everything was homogeneous, then we should not observe the set of local peaks in the histogram, but they are there.
As you can see, there are pronounced peaks around 0.1, 0.2 and 0.25. I suggest the reader to find and “name” these classes.
I want to note that R is rich in algorithms for data clustering, for approximation, for testing hypotheses, etc.
If you really want to dive into the world of R, I recommend the following links. Please share in the comments your interesting blogs and websites on R. Is anyone writing about R in Russian?
I believe that such languages as R, haskell, lisp, javascript, python - every self-respecting programmer should know: if not for work, then at least to expand the horizons!
PS Promised source
Purpose: To collect data from the beloved HabraHabr by means of the R language and to carry out, in fact, what the R language was created for, namely: statistical analysis.
So, after reading this topic you will learn:
- How can R be used to extract data from Web resources
- How to convert data for later analysis
- What resources are highly recommended for reading for everyone to get acquainted with R closer
')
It is expected that the reader is self-sufficient enough to become familiar with the basic structures of the language. For this, the links at the end of the article are better suited.
Training
We will need the following resources:
After installation, you should see something like this:
In the right bottom panel on the Packages tab, you can find a list of installed packages. We will need to additionally install the following:
- Rcurl - to work with the network. Anyone who has worked with CURL will immediately understand all the possibilities.
- XML - package for working with DOM tree XML document. We need the functionality of finding elements by xpath
Click “Install Packages”, select the ones you need, and then select them with a check mark to load them into the current environment.
Get the data
To obtain a DOM document object obtained from the Internet, it is enough to execute the following lines:
url<-"http://habrahabr.ru/feed/posts/habred/page10/" cookie<-" " html<-getURL(url, cookie=cookie) doc<-htmlParse(html) Pay attention to the transmitted cookies. If you want to repeat the experiment, then you will need to substitute your cookies, which your browser receives after logging in to the site. Next we need to get the data we are interested in, namely:
- When the entry was posted
- How many views
- How many people registered in favorites
- How many clicks on +1 and -1 (total)
- How many +1 clicks
- How much -1
- Current rating
- Number of comments
Not giving in particular in details I will give the code immediately:
published<-xpathSApply(doc, "//div[@class='published']", xmlValue) pageviews<-xpathSApply(doc, "//div[@class='pageviews']", xmlValue) favs<-xpathSApply(doc, "//div[@class='favs_count']", xmlValue) scoredetailes<-xpathSApply(doc, "//span[@class='score']", xmlGetAttr, "title") scores<-xpathSApply(doc, "//span[@class='score']", xmlValue) comments<-xpathSApply(doc, "//span[@class='all']", xmlValue) hrefs<-xpathSApply(doc, "//a[@class='post_title']", xmlGetAttr, "href") Here we used the search for elements and attributes using xpath.
Further, it is highly recommended to generate data.frame from the obtained data - this is an analogue of the database tables. It will be possible to make requests of different levels of complexity. Sometimes you wonder how elegant you can do this or that thing in R.
posts<-data.frame(hrefs, published, scoredetailes, scores, pageviews, favs, comments) After the data.frame is formed, it will be necessary to correct the received data: convert the lines into numbers, get the real date in the normal format, etc. We do it this way:
posts$comments<-as.numeric(as.character(posts$comments)) posts$scores<-as.numeric(as.character(posts$scores)) posts$favs<-as.numeric(as.character(posts$favs)) posts$pageviews<-as.numeric(as.character(posts$pageviews)) posts$published<-sub(" ","/12/2012 ",as.character(posts$published)) posts$published<-sub(" ","/11/2012 ",posts$published) posts$published<-sub(" ","/10/2012 ",posts$published) posts$published<-sub(" ","/09/2012 ",posts$published) posts$published<-sub("^ ","",posts$published) posts$publishedDate<-as.Date(posts$published, format="%d/%m/%Y %H:%M") It is also useful to add additional fields that are calculated from those already received:
scoressplitted<-sapply(strsplit(as.character(posts$scoredetailes), "\\D+", perl=TRUE),unlist) if(class(scoressplitted)=="matrix" && dim(scoressplitted)[1]==4) { scoressplitted<-t(scoressplitted[2:4,]) posts$actions<-as.numeric(as.character(scoressplitted[,1])) posts$plusactions<-as.numeric(as.character(scoressplitted[,2])) posts$minusactions<-as.numeric(as.character(scoressplitted[,3])) } posts$weekDay<-format(posts$publishedDate, "%A") Here we all well-known messages of the type “Total 35: ↑ 29 and ↓ 6” converted into an array of data on how many actions were taken at all, how many advantages there were and how many minuses there were.
At this point, it can be said that all data has been received and converted to a format ready for analysis. I designed the code above as a ready-to-use function. At the end of the article you can find a link to the source.
But the attentive reader has already noticed that in this way, we obtained data for only one page in order to get for a whole series. To get the data for the whole list of pages, the following function was written:
getPostsForPages<-function(pages, cookie, sleep=0) { urls<-paste("http://habrahabr.ru/feed/posts/habred/page", pages, "/", sep="") ret<-data.frame() for(url in urls) { ret<-rbind(ret, getPosts(url, cookie)) Sys.sleep(sleep) } return(ret) } Here we use the system function Sys.sleep in order not to accidentally arrange the habraeffect itself :)
This function is proposed to use as follows:
posts<-getPostsForPages(10:100, cookie,5) Thus we download all pages from 10 to 100 with a pause of 5 seconds. Pages to 10 are not interesting to us, since the estimates are not visible there yet. After a few minutes of waiting, all our data is in the posts variable. I recommend to save them right away, so as not to disturb Habr every time! It is done this way:
write.csv(posts, file="posts.csv") And we read as follows:
posts<-read.csv("posts.csv") Hooray! We learned to get statistical data from the habr and save them locally for the next analysis!
Data analysis
This section I will leave unsaid. I suggest the reader to play with the data himself and get his own conclusions. For example, try to analyze the dependence of mood plus and minus depending on the day of the week. I will cite only 2 interesting conclusions that I made.
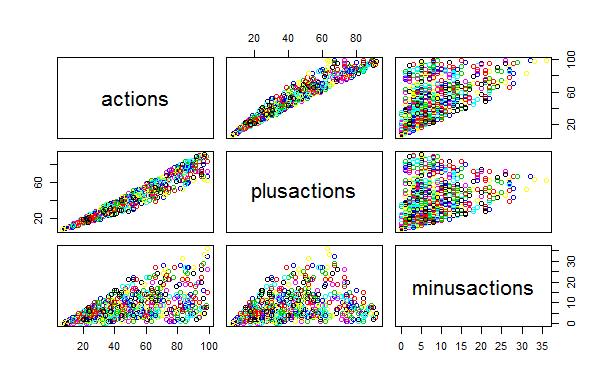
Habr users are much more willing to plus than minus.
This is seen in the following graph. Notice how much the "cloud" of the minuses is more even and wider than the spread of the pros. The correlation of pluses from the number of views is much stronger than for minuses. In other words: plus without thinking, and minus the cause!
(I apologize for the inscriptions on the graphs: until I figured out how to display them correctly in Russian)
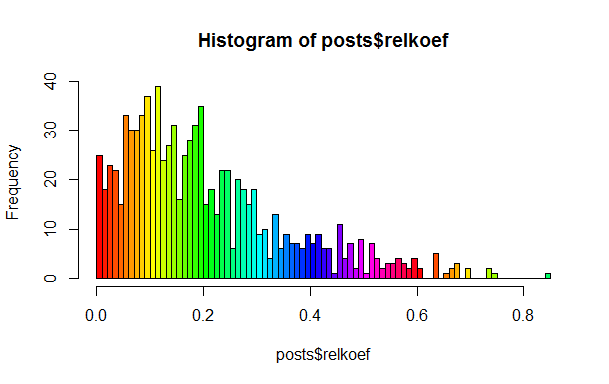
There are indeed several classes of posts.
This statement in the post mentioned was used as a given, but I wanted to see this in reality. To do this, it is enough to calculate the average share of benefits to the total number of actions, the same for minuses and divide the second into the first. If everything was homogeneous, then we should not observe the set of local peaks in the histogram, but they are there.
As you can see, there are pronounced peaks around 0.1, 0.2 and 0.25. I suggest the reader to find and “name” these classes.
I want to note that R is rich in algorithms for data clustering, for approximation, for testing hypotheses, etc.
Useful resources
If you really want to dive into the world of R, I recommend the following links. Please share in the comments your interesting blogs and websites on R. Is anyone writing about R in Russian?
I believe that such languages as R, haskell, lisp, javascript, python - every self-respecting programmer should know: if not for work, then at least to expand the horizons!
PS Promised source
Source: https://habr.com/ru/post/162583/
All Articles