How expert supply chain optimization systems work in practice
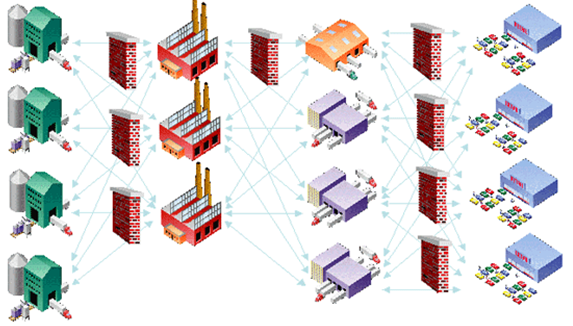
Suppose this is your supply chain. Now the expert system will optimize it.
Introductory : Imagine that you are some kind of company that produces tablets and phones - Mayfuns and Maypadas. You yourself are sitting in California, you have several factories in the East, plus you regularly order a bunch of all sorts of components from those suppliers from whom it is more profitable to carry. And you also have your own retail chain of stores that sell tablets and phones.
In the topic - how a manufacturer of equipment can work with logistics, collecting products from components from around the world. Well, or a retail network, which also has non-trivial supplies.
')
There are three problems:
- Our logistics is so complex and extensive that now dozens of people are working on it: someone distributes mayfuns, someone scatters covers the stores, and production workers figure out the best ways to collect components from factories around the world.
- At the same time, I want to save on the logistic scheme: you suspect that a smart analysis of all the flows will allow you to make decisions, for example, on the location of opening a new production or organizing an additional warehouse, which will ultimately benefit you.
- And while your people are constantly mistaken with the shipments - and I want to make sure that nothing and nowhere is forgotten, everything works like a clock and goods come to the point in time. This is also a saving, but already due to the timeliness of deliveries and the absence of errors.
Basic delivery scheme on the map
It is assumed that you are already making a forecast of demand and supply volumes (you can read here ) and have completed the first step in the implementation of expert IT systems for analyzing data on demand and production ( here ). In the past topics, we set up a demand prediction, and you, thanks to your buyers and marketers, know exactly how much and what kind of products the market as a whole may need, and how it will be distributed across your stores.
This is what we do in such cases.
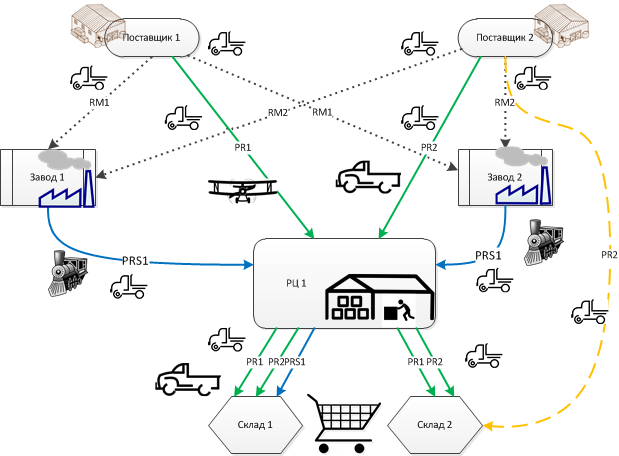
- To begin with - we denote on the map all sources of products, warehouses and our points .
There are places where products are taken (production of materials and components), where products are collected (plants connecting the aluminum case, microcircuit, battery and camera), where products are stored (distribution nodes) and where the goods are sold (stores). It turns out a network of places, including the complete chain from the production of acid to the battery to the sale of the finished tablet to the client.
- Now we impose restrictions for each point and each type of supply .
For example, plant A is able to ship boxes only with a batch of 20,000 pieces, warehouse B does not work on Saturdays, store C has such a working schedule for receiving goods, only 500 tablets can be collected at production D per day, storage at each point costs so much and so on.
- We set the conditions of delivery for each point .
For example, a plant producing cameras for tablets has price steps depending on the lot size: 10,000 pieces cost N money, 30,000 pieces cost 2N, and 100,000 pieces cost only 5N. Moreover, its warehouse can ship no more than 100 cubic meters of products per day. Another example - it happens that shipment in warehouse E is possible only once every two weeks, but to everyone who has accumulated at once, but another warehouse can deliver products every day, but it is necessary to calculate the optimal schedule for deliveries.
- Now we set the transport data .
From here cars of such carrying capacity and with such speed go, from here you can send by sea on a ship, there is an option with a railway and an airplane and so on.
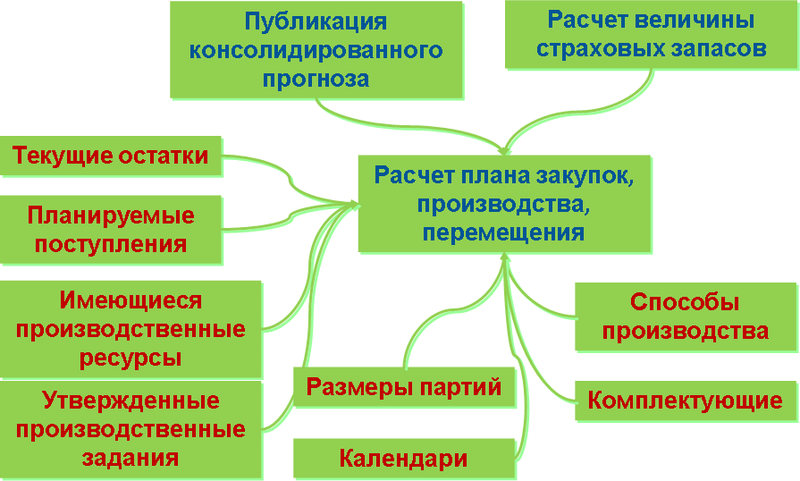
For each transport - a possible schedule, delivery time, volume of the body and other parameters, including cost. - We set assembly recipes on intermediate points .
For example, to make a tablet, you need to connect a bunch of chips, battery, camera, screen, and so on.
All these parts can be produced at different factories: later the system will calculate from where it is best to supply and how to place orders. - Above all of this, calendars of various external factors are unloaded , in particular, national holidays of countries.
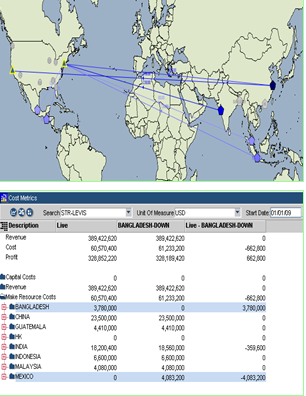
7. The system finds the optimal sources of supply, production and delivery routes taking into account such optimization criteria as minimizing total costs or maximizing profits .
8. The result is a collection of data on how each point in our supply chain works and calculates the optimal schedule of orders and movements. At the same time, the system considers all movements up to a minute, which is often unnecessary - therefore, a filter is superimposed on top of all this, which makes it clear that it is necessary to operate in a slightly different plane of accuracy, more applicable to reality.
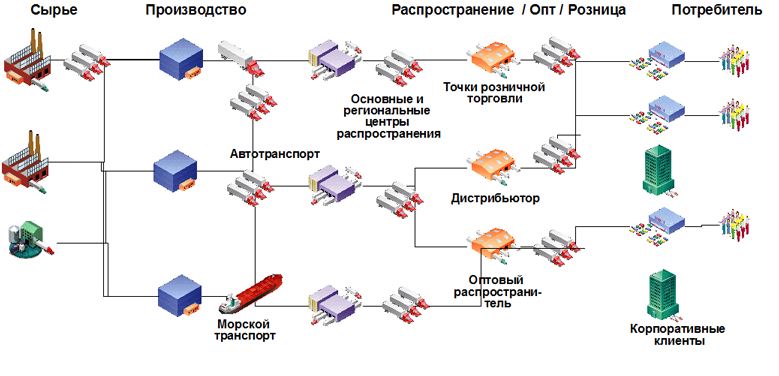
Optimized scheme
This solves three important tasks.
- First, a plan is compiled on what, when and where should it go and when what is launched for sale.
- Secondly, you can include new points in the network (for example, a new remote plant offering cheaper production, a new store or a new intermediate warehouse) to understand how this will change the cost of all operations and terms.
- And, thirdly, you can load in this logistic module the data of forecasting the volume of demand of your retail network (or any other input data) - this will determine the production plan and help you understand how to work in what period. For example, it may turn out to be cheaper to stop one of the factories and transport everything through the central warehouse of the half-season, for three more months to load both factories equally and transport them from one of them directly to some place, and at the end of the season to connect the third production for New Year's peak and carry goods from there by plane.
The final plan contains information about the violation of “soft” restrictions: for example, the system may reveal a “bottleneck” of the production process or recommend purchasing less (there will be fines, but they will provide a smaller loss than long-term storage of the goods), charter the aircraft not in the standard schedule and so on.
The same system is used to predict the optimal distribution of a limited product. Imagine that an emergency like an earthquake occurred at one of our productions, and by the end of the year we will receive only 70% of the expected number of tablets. It is necessary to understand how to scatter them optimally between their stores and how much to give to other networks: you can manually set restrictions like “they need to load at least 1,000 pieces”, “these have 30 pieces in the display case, so they should always be less than” and “this priority store ”, and then get a forecast of where and how much it costs to send, taking into account all the logistical factors, given restrictions and expected profits.
Assembly cycles
Summary
The system is able to predict demand, build an optimal product distribution chain, helps make strategic decisions (there are a number of modules for this), allows you to calculate scenarios for the emergence of new points, routes and so on, evaluates each change in external factors and makes it possible to build marketing forecasts.
If you look at this system more broadly, it becomes clear that it automates all time-consuming and complex analytics processes, selects tasks with the highest priorities or the impossibility of algorithmic processing and asks people about them. In fact, the joke is that purchasers and logisticians are the biomodules of this system, which is quite true. The expert system really works in a kind of symbiosis with the person: it processes a large amount of data and correctly builds all the plans (the person is not capable of such accuracy and performance), but at the same time highlights questionable solutions and gives them to the outside, where there is a “biosystem”, which is aware of everything that cannot be predicted directly.
The result is a tool that saves a lot of money, gives control over what is happening in logistics and allows you to make transparent decisions.
The usual result in conjunction with the demand forecasting module looks like this:
- The accuracy of the forecast increases by 15-20%.
- The labor intensity of the process is seriously reduced.
- Stocks are reduced by 10-15%.
- The level of service (availability of goods) is growing by 5-10%.
- The number of errors caused by human factors decreases.
- Transportation costs are reduced by 10-30%.
- It becomes possible to work in a single information space with the same source data.
- The manager controls and sees each flow: this is the transparency and controllability of the structure.
Ready to answer questions in the comments. If you are not at Habré, or you want to discuss everything in the mail, write to eneveykin@croc.ru . If you need the cost of implementation for your retail or production, answer Alexey Isaev, alisaev@croc.ru .
Source: https://habr.com/ru/post/162453/
All Articles