How to draw Zelenograd
 Watching the video Russia: Edits to OpenStreetMap 2007-2012 from ITO World, I wanted to make my own - only in Zelenograd. So that you can clearly see the details and even minor edits.
The implementation took more than 2 weeks.
In this article I will tell how it was done.
The video itself is immediately under the cut.
')
Watch Full 1080p Fullscreen with Sound
Creating such a video is divided into 2 main parts:
- Get the right data
- Collect a video from this data.
Get the right data
Obtaining historical data is somewhat hampered by the OpenStreetMap architecture, which is designed for the rapid issuance of the current map and editing, but not for uploading history. Additionally, the task is complicated by changing the license from CC-BY-SA to ODbL, which led to the removal of some of the objects from the database and some other change history. Zelenograd suffered when changing the license is very strong, at 7:18 it is clearly seen in the video.In general, while there is no service that would allow conveniently download the entire history of all objects in a certain area.
What do you need
To start, of course, you need to decide what to download.Zelenograd along the administrative border fits pretty well into an almost square frame. However, it is impossible to hook the nearest surroundings (Mendeleevo, Chashnikovo, Goluboye, Firsanovka, Pyatnitskoe Highway, etc.) without turning, skewing or significant distortion of the scale. It was decided to add only Firsanovskoye Highway .
Full HD 1920x1080 turned out to be somewhat disproportionate - Zelenograd in the center, incomplete Firsanovka and Skhodnya in the lower right corner and empty other angles. When saving vertical resolution in 1080 lines, the minimum frame was 1220x1080. After some meditation on the video resolution scheme , it was decided to expand to 1440x1080.
To download the data, bbox 55.92-56.05,37.08-37.31 was taken - with a margin under the lines extending beyond the edge of the frame.
Data sources
From the main sources there is (at the time of writing):- The main database, issuing only ODbL data - either current in the region, or history by object, or changeset.
- The last full historical dump (full history planet file) of October 19, weighing 37 GB in the bz2 archive, only ODbL data. Those. 300-500 GB in unpacked form, a month and a half ago and not the whole story.
- The last complete historical dump under SS-BY-SA from June 1, weighing 35 GB in the bz2-archive. This is 1.5 months before the “cutting out” by the bot of data incompatible with ODbL and 4.5 months before the license change.
- Daily , hourly and minutely diffs - as the current base for ODbL, and the era of CC-BY-SA , and the transition period .
- Various downloads complete history .
- The diurnal defaults of Russia on gis-lab unfortunately contain omissions, the planetary ones do not, but all of them contain only final versions of modified objects, i.e. not quite suitable for video more detailed than 1 frame per day.
Experiments have shown that cutting the necessary data from a complete historical dump requires substantial resources. For example, the history-excerpt.pl script complained about the lack of RAM, even when it was 6 GB.
As a result, a mixed version was chosen:
- The history until 2012.04.01 is taken from the unloading of Russia from Simon Poole (russia.osh.bz2 - 1 GB), only 17 GB in unpacked form.
- The story from 2012.04.01 to 2012.08.31 is taken from the daily diffs of the transition period . Diffs docked with the era of CC-BY-SA is not complete (some of the April 1–4 edits are only in hourly and minute changes), but the Zelenograd edits are all daily. However, 65 GB in unpacked form.
- The story from 2012.09.01 is taken from the main base by pumping out all the changeset in Zelenograd. The changeset list was obtained by downloading hundreds of pages of the history of changing a rectangular area from the site openstreetmap.org. This source produces a lot of unnecessary data (for example, Alaska import caught, did not download), but for a short period the amount of data is small - only 90 MB.
Cut the desired fragment
According to the current architecture, in OSM 3 entity types are node, way, and relation. But if node (point) has coordinates, then way (line) is only a list of node and has no own coordinates. To upload data for a specific area, this means that you need to select the necessary node, but to select the necessary way, you need to check all the nodes it uses. Those. it is necessary to build a sparse list of nodes (identifiers have almost reached 2 billion), allowing you to quickly check the way for it.Relation is used to group objects and draw complex constructions; they can consist of node, way, and other relation ones, including forming any level of nesting and looping. For this video, it was decided not to load them and not to display them - since they do not give additional geometry (they can affect the order of painting over areas that are not used in the video).
After several experiments, the following order was chosen:
- The node list was compiled using the egrep utility, which is a regular expression
very quickly pulled all the data through itself (including the packed data was sent to it from the archive without saving to a file).
Next, only the node id (two egrep, sort and uniq) were pulled out of the list and saved to a file. It took about 30 minutes in total. - A specially written program line by line (without parsing XML) scanned the file and pulled out full information about all versions of the found node and about all the ways that use at least one of the selected nodes. For daily diffs, in which the visible attribute for objects is not specified, this attribute was added based on an external tag (<delete>, etc.). The search for the node list (about 170 thousand as a result) was speeded up by a 16-bit index (the upper 16 bits from the node id 32-bit representation). For the list of way, refilled on the fly, the index was not used, because Way gained only 26 thousand and verification is required much less. It took about 7 hours, of which 5 hours - for 150 daily diffs.
The result was checked for correctness:
- Verification of the successive increase in the versions showed that there are no gaps. The latest versions of way 8038408 , which in 2008 went from Torzhok to Zelenograd, were removed manually, and now there is only for Torzhk and accidentally got into the list of changes received from openstreetmap.org
- The cuts of the unloading for the necessary days coincided with the unloadings of the city of 2009-2012 that I had saved, as well as the clippings from the selective unloading of the Moscow region from gis-lab for 2012.
However, when drawing the frames, it was found that way 23273948 , which set the boundary of the Yahoo satellite image in 2008-2010, until April 2009 got into my bbox with only 1 dot and, accordingly, was drawn incorrectly. Additional nodes of this way were added to the upload manually.
The final download can be downloaded (6.3 MB to rar) .
Do not forget only that this is data collection under two licenses - CC-BY-SA 2.0 for everything before 2012-09-12T10: 00: 00Z and ODbL 1.0 after.
Make a video
After receiving the data you can start drawing.However, you first need to determine the speed of the video.
The initial idea of making the speed constant collapsed at the sight of the list of first edits
- 2005-11-10T17: 35
- 2007-04-02T12: 30
- 2007-09-29T11: 29
The overall rate of 1 frame per day seemed too high. 5 years of more or less active edits - 1,830 frames, a little more than a minute.
1 frame per hour will give 30 minutes of video, this is too much.
I stopped at option 1 frame at 4 o'clock (i.e. x360000 relative to reality).
Taking into account the scrolling at the beginning it turned out 11,800 frames, 7:52.
Chronokadry
To draw frames, you must either keep all versions of all objects in quick access, or “overlay” changes consistently over time and draw frames at the right moments. Stopped on the second version.Since the unloading from Simon Poole is organized “all node - all way - all relation”, it had to be somehow streamlined over time. A simple program (again line by line without parsing XML) was unloaded into chrono frames — changes for each 4-hour interval were recorded in a separate file, named after the frame time. It took about 10 minutes.
Now it is enough to load chronokadry consistently and after each draw an image.
The unloading, laid out a little higher, is actually a consistent docking of all chrono frames, since the original was uneven on the structure.
SVG rendering
In order not to invent our own raster renderer, it was decided to create vector SVGs, which could then be converted into raster by ready-made programs. SVG is convenient because it is xml-but text-based and supports all sorts of convenient things like translucency.To create SVG, I had to write the program again, now with XML parsing. However, the amount of data has become quite acceptable.
Rendering took 1 hour and 15 minutes. The total amount of SVG - 15 GB.
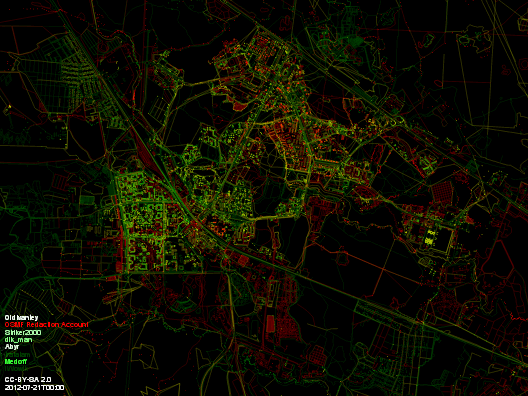
20120720080000.svg - the last frame before the arrival of the bot
20120721000000.svg - apogee of cutting out non-ODbL data
I want to note that different programs sometimes interpret SVG in different ways and you have to be prepared for this. Chromium, with which I looked at the generated files, sometimes showed me a different picture, as then did ImageMagick. SVG formation had to be adjusted several times.
Convert to raster
Originally planned to convert SVG to PNG , as the most suitable format for raster schemes. However, I could not make friends with avidemux with PNGs formed by ImageMagick, avidemux persistently flooded me with a green frame.As a result, the conversion was made to BMP.
The convert utility from ImageMagick worked with a single key — type truecolor
The process took 6 hours. The total amount of BMP is 53 GB.
Build video
The video was assembled from a pack of BMP files by the avidemux program.The Xvid codec was chosen as GNU-shny and well-proven. Regarding the standard settings, only the quantizer was rearranged by 2.
The build took about 25 minutes.
Video without music laid out as a file (137 MB) under the license CC-BY-SA 3.0
The two frames of SVG above are also under this license.
Music overlay
Music from my collection is not compatible with CC licenses, so the music version was made for youtube.To fill almost 8 minutes, the most epic fragments of the compositions were taken.
- Vangelis - Voices (from about 1:00 to 6:50)
- Bond - Elysium (approximately from 0:30 to 2:30)
Music mixed in Adobe Audition, pasted on the video in VirtualDub
Binding of some events to the music was not done, all coincidences are random.
Result
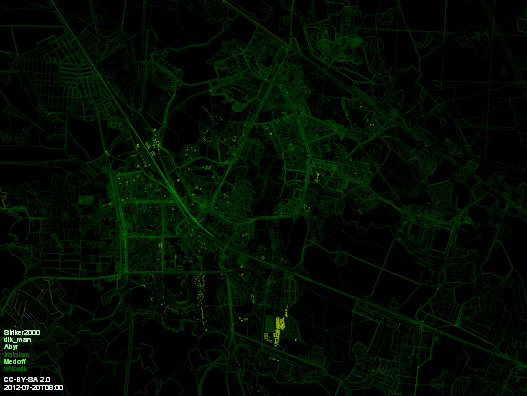
What is displayed on the video:
- Timestamp and license at the relevant moment
- All unloaded way - lines
- All unloaded nodes that are not in any way - dots
- New objects flash white and slowly fade to green and dark green.
- Modified objects flash yellow and slowly fade to green and dark green.
- Deleted objects flash red and disappear smoothly (i.e. visible after actual deletion)
- If the nodes that are included in the way are modified, but the way itself does not change, the nodes flash with yellow dots and fade out.
- The nicknames of all those who performed the editing in the visible area are displayed - flashing white at the time of editing, gradually goes out to green and disappears
- Nicknames of two administrative accounts that have cut out non-ODBL data - flashing red
Thanks:
- Simon Poole - for the full history of unloading Russia on April 1, 2012.
- Larry0ua - for the idea of using daily diffs.
- giner - for the idea of showing nicknames, help on using Linux utilities and beta testing.
- By ImageMagick, avidemux, VirtualDub, Xvid, osmconvert and Ubuntu
Suggestions accepted:
- How to assemble a "video" in the form of 1 SVG with animation
- What video codec to use for better transmission of such wireframe graphics
Source: https://habr.com/ru/post/161975/
All Articles