View OpenCV images while debugging C ++ code in Visual Studio
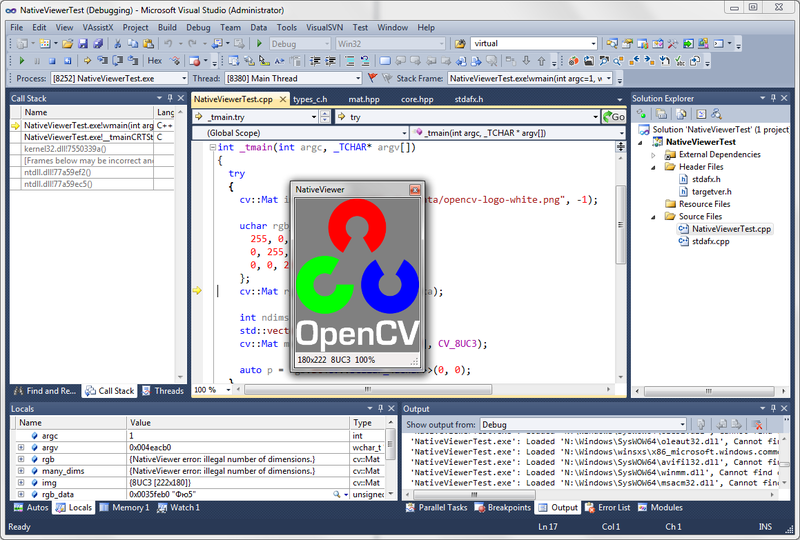
If you write code to process images in C ++, you probably use the wonderful OpenCV library . I am sure you have repeatedly wanted to look at the images in the process of debugging your code. To do this, you can use such convenient functions as imshow or imwrite . However, this requires modification of the source code, and any modern IDE during debugging allows you to watch the values of variables on the fly. Wouldn't it be great to look at the images?
If you use Visual Studio as an IDE, then you know that everything is simpler with .NET . However, we are talking about OpenCV, and this is only native C ++, only hardcore. In this article, I’ll tell you how to make Visual Studio show images right during the debugging process and give you a link to a ready-made solution. And also briefly talk about how to customize Visual Studio.
Introduction
For those who just want to use a ready-made solution, I’ll immediately provide links:
')
- NativeViewer at SourceForge
- NativeViewer for Visual Studio 2010 in Visual Studio Extensions Gallery
- NativeViewer for Visual Studio 2012 in Visual Studio Extensions Gallery
I will briefly tell the rest about the tools with which you can, in principle, customize Visual Studio, and in more detail about the implementation of the solution by one of them. All experiments were performed in Visual Studio 2010, the turnkey solution was tested in Visual Studio 2005, 2008, 2010, 2012 (and in theory should work in 2003).
Search for a turnkey solution
When I needed to work on debugging C ++ code that uses OpenCV for working with images, I immediately wanted to be able to watch them directly during debugging. I happily climbed into Google, and began to look for ready-made solutions. And ... found nothing. Neither for OpenCV images, nor for generally visualizing anything from native C ++ code. I asked the public what the resident credible said to me that , in principle, the native code debugger cannot be extended in this way. At this point, I was convinced that the bike was not yet invented.
Visual Studio Customization Features
To choose a suitable tool for the visualizer, you need at least an approximation of which sides you can extend Visual Studio from. First we need to know two things:
- DTE Visual Studio Interface, which was introduced in .NET versions (since 2003). With it, you can get objects that provide access to the most different parts of Visual Studio — the solution structure, shell settings, active window, even the debugger.
- The MEF Managed Extensibility Framework is a newer model, available from Visual Studio 2010. Allows for tighter integration and allows for interoperability of MEF components, which in turn can use DTE.
The following is a list of entities used to customize Visual Studio. The list was compiled for a specific task, therefore it does not claim to be complete.
- Macros (Macros) Excellent for automating any actions performed on the source code, project structure, etc. With their help, you can check the style of the code, generate templates, record and play back some user actions. Have access to DTE. Available in Tools → Macros.
- Add-ons (Add-Ins) Appeared since Visual Studio .NET. Used for any conceivable customization, from improved syntax highlighting to integration of the version control system. Have access to DTE. Available through Tools → Add-In Manager.
- Extensions Appeared since Visual Studio 2010, are a more advanced version of add-ons (a list of differences here ). Interact with MEF. Available through Tools → Extension Manager.
- Visualizers (Visualizers) Designed to display objects in the debugging process. Available when clicking a small icon with a magnifying glass next to the variable name when displaying its contents.
It would seem that visualizers are exactly what you need. But here's the bad luck - they only work with managed C ++. The first three options (macros, add-ons and extensions) can access the memory of the process being debugged only by using the Debugger object, which only has ExecuteStatement and GetExpression from the appropriate functions. However, both of them somehow return the results in the form of strings limited in size. Of course, you can try to tear out the contents of the image piece by piece and translate it back into a binary form, but it turns out somehow very crooked.
There is also such a magic file called autoexp.dat. It is installed with Visual Studio and usually lies at
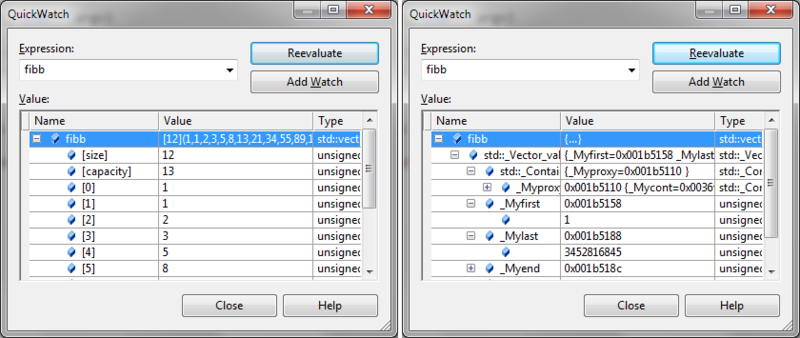
:\Program Files (x86)\Microsoft Visual Studio <vs_version>\Common7\Packages\Debugger\autoexp.dat It describes the rules according to which the contents of variables are displayed when debugging native C ++ code. It is he who makes, for example, the contents of the std :: vector container look like on the left, not like on the right:
And this is how he does it:
Output rule std :: vector in autoexp.dat
 ; ------------------------------------------------- -----------------------------
 ;  std :: vector from <vector>
 ; ------------------------------------------------- -----------------------------
 ;  vector is previewed with "[<size>] (<elements>)".
 ;  It has [size] and [capacity] children, followed by its elements.
 ;  The other containers follow its example.
 std :: vector <*> {
	 preview (
		 # (
			 "[",
			 $ e._Mylast - $ e._Myfirst,
			 "] (",
			 #array (
				 expr: $ e._Myfirst [$ i],
				 size: $ e._Mylast - $ e._Myfirst
			 ),
			 ")"
		 )
	 )

	 children (
		 # (
			 # ([size]: $ e._Mylast - $ e._Myfirst),
			 # ([capacity]: $ e._Myend - $ e._Myfirst),
			 #array (
				 expr: $ e._Myfirst [$ i],
				 size: $ e._Mylast - $ e._Myfirst
			 )
		 )
	 )
 }
 std :: _ Vector_iterator <*> | std :: _ Vector_const_iterator <*> {
	 preview (
		 * $ e._Ptr
	 )

	 children (
		 # ([ptr]: $ e._Ptr)
	 )
 }
This is an old, poorly documented technology. It is supported starting from Visual C ++ 6.0. A small guide on the use here . However, it turned out that it is she who will
It turns out that the syntax of the autoexp.dat file allows not only to write expressions for, for example, address arithmetic, but also to call any third-party code in general! This is done using the special $ ADDIN construct. In the absence of the best, I used this tool for my visualizer.
Expression Evaluator Add-In Solution
A small guide to writing libraries for the autoexp.dat file is available on MSDN , where they call it the Expression Evaluator Add-In. To call a library function, simply specify the path to the .dll file and the name of the function being called.
cv::Mat=$ADDIN(NativeViewer.dll,CvMatViewer) The prototype of the function in the dll is as follows:
HRESULT WINAPI CvMatViewer(DWORD dwAddress, DEBUGHELPER* pHelper, int nBase, BOOL bUniStrings, char* pResult, size_t max, DWORD reserved) In the pHelper argument, a pointer is passed to the DEBUGHELPER structure, which provides functions for accessing the memory of the process being debugged and returns the address of the object displayed in the debugger:
Structure Code DEBUGHELPER
typedef struct tagDEBUGHELPER { DWORD dwVersion; HRESULT (WINAPI *ReadDebuggeeMemory)( struct tagDEBUGHELPER *pThis, DWORD dwAddr, DWORD nWant, VOID* pWhere, DWORD *nGot ); // from here only when dwVersion >= 0x20000 DWORDLONG (WINAPI *GetRealAddress)( struct tagDEBUGHELPER *pThis ); HRESULT (WINAPI *ReadDebuggeeMemoryEx)( struct tagDEBUGHELPER *pThis, DWORDLONG qwAddr, DWORD nWant, VOID* pWhere, DWORD *nGot ); int (WINAPI *GetProcessorType)( struct tagDEBUGHELPER *pThis ); } DEBUGHELPER; In pResult, you need to save the string shown by the debugger. In theory, this is all that this function should do. But who will stop us? We already have access to memory. And then, as they say, the matter of technology.
Extract image content
The only type information currently available to us is its name, cv :: Mat. This means that you have to calculate the field addresses based on the .h file of a particular version of OpenCV. However, I do not think that in the future the structure of the fields of this fundamental class will change.
I will not dwell on technical issues in detail, such as knowing how to read an object from memory, knowing its address and having an .h file with its description, the sources are uploaded to SourceForge. I will only note that the pHelper structure allows you to find out the bit depth of the process being debugged. This means that you need to take into account that pointers can be either 4 or 8 bytes in size. When we read all the fields of the cv :: Mat object, we can also read the contents of the image itself, because its address is in the data field.
Formatting the display string
Well, since we're still here, let's really format the line displayed by the debugger. And then the standard insides do not look very nice. We do something like this:

Image visualization
Actually, for the sake of what we are here and gathered. Now that we have an image, we can render it using .NET. I used the good old Windows Forms and C #. The form with the dialog for visualization is in a separate assembly, the System.Bitmap object is passed to it in the constructor. To construct it, the original dll was built with .NET support, with the / clr key. This allowed the use of C ++ / CLI.
I was worried that calling the .NET-dialog from the native library would cause difficulties and would have to create the AppDomain myself. However, since the studio itself is a .NET application, nothing like that was done. It all worked right away, so I didn’t begin to understand more. I will only note that I had to show the dialogue from a separate thread with the ApartmentState :: STA parameter, otherwise there were problems when opening additional dialogs, for example, to save the image to a disk.
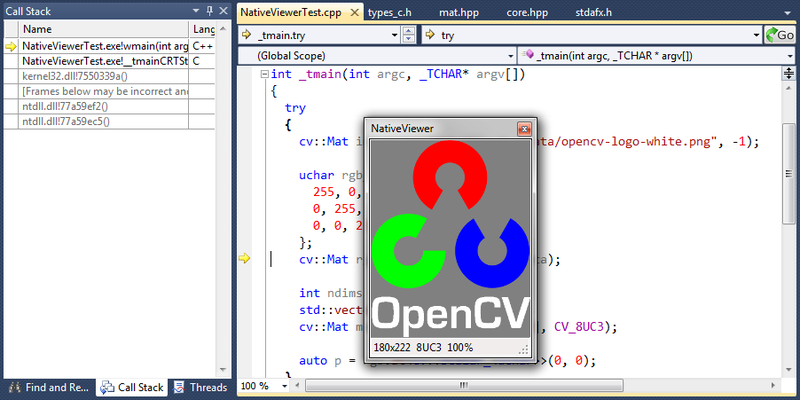
Now we are faced with the main drawback of the chosen approach - it is impossible to determine whether the function is called when formatting the output in the Watch window, or when the user hovers over a variable in the editor. If every time to show the window with the image, it will not be possible to use it.
The only adequate solution that I could come up with is the following: the window is displayed only if any special key is pressed. Namely, Ctrl. Otherwise, only the output string is formatted. Thus, in order to view the image in the process of debugging, the user needs to hold down Ctrl, aim the variable in the editor and then a window will pop up. Crooked, yes, but in fact it turned out to be quite convenient to use.
When the window with the image is shown, the Visual Studio process is blocked, because formally, we are in the debugger output formatting function. This is unpleasant, but there is nothing fatal about it, because There is no need to simultaneously study the image and continue to interact with the studio.
Integration with Visual Studio
There is a solution, now you need to pack it. The existing extension mechanism is great for this. Initially, I focused on Visual Studio 2010, so I chose more modern extensions, and not more universal add-ons.
Creating extensions is well documented . First, we need the Visual Studio SDK (for 2010 or 2012). After installation, you can create a new Visual C # → Extensibility → Visual Studio Package project. This will launch a wizard that will ask for information about the extension:
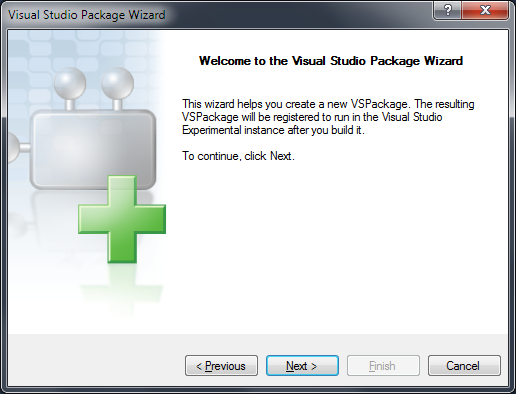
By default, he suggests creating a menu command (Menu Comand), a tool window (Tool Window), or tweaking the editor (Custom Editor). We do not need any of this. The fact is that the extension is a VSIX file, which is just a zip archive. When installed in Visual Studio, it unpacks it into one of the user directories (more details here ). There may be libraries interacting with MEF, but there may be any other files. For example, our library with Expression Evaluator Add-In.
There is a small problem with loading the assembly with a form for visualization. If you add it to References, then its search will occur in the directory with the devenv.exe executable file and in the GAC . It is also located in the directory with the extension, so it has to be loaded manually using the Assembly :: LoadFrom function . The dialogue is then created and displayed using the reflection- methods.
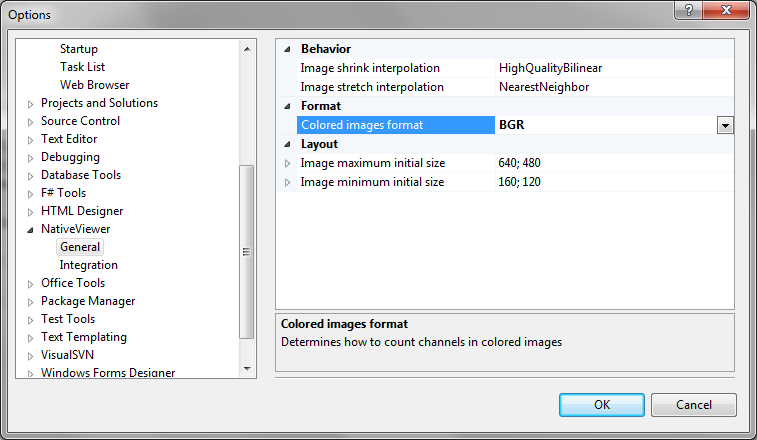
I wanted to make settings that could be changed from the Tools → Options menu. This is well described in the MSDN manual . It describes how to create a standard key / value grid, and an arbitrary form:
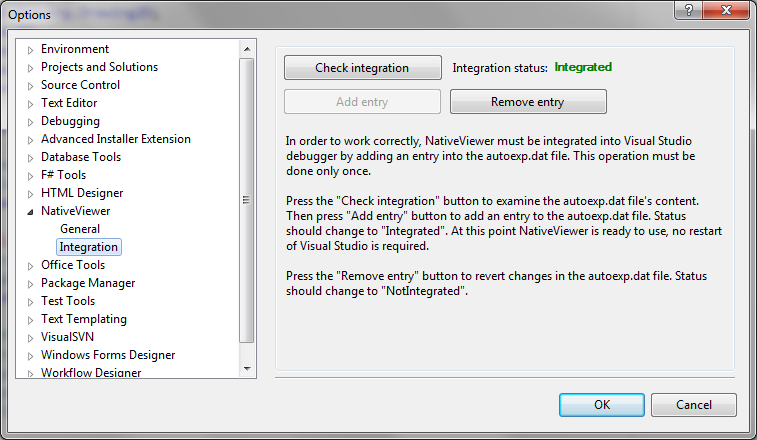
The last form will be needed to automatically add a line to the autoexp.dat file. Unfortunately, there is no possibility to execute any command at the time of the installation of the VSIX extension (see the Supported Capabilities table here ). Therefore, after installing the extension, the user needs to go to this page and click the “Add entry” button.
To find the autoexp.dat file, you need to know where Visual Studio is installed. This can be viewed in the registry, but it is better to ask her herself with the help of DTE. How to get a DTE object from an extension is written here . The FullName property will return the full path to the devenv.exe file.
I was pleasantly surprised by Visual Studio 2012. It finally proposed replacing the outdated autoexp.dat file - the NATVIS technology. There is no documentation as such yet, but there is a good description on the Microsoft blog. And, the glory of backward compatibility, they left the possibility of calling third-party code through the same mechanism, only now it is specified in the LegacyAddin argument. The only description that I found in the answer to this question . It is felt that the technology has recently been announced.
A huge plus of NATIVS is that now the rules of visualization (drawn up as separate XML files with the natvis extension) can be scattered in different directories. Including on user, and also they can be contained in extensions. To do this, the .nativs file is enough to add to Assets when building an extension. Therefore, in the NativeViewer extension for Visual Studio 2012 there is no page with integration and it works out of the box.
Regarding debugging VSIX extensions. This turned out to be implemented very conveniently. When you run a VSIX project, an experimental copy of Visual Studio opens in which the current version of the extension is installed. Debugging works fine, I managed to debug the native code in the dll in the source studio, which was loaded by an experimental copy.
Since extensions appeared only in Visual Studio 2010, earlier versions will have to be manually installed. So far I have written the manual , but in an amicable way, of course, you should make an installer.
Conclusion
In this article, I described a solution to the problem I encountered during the development process. Remarkable is the fact that it is intended for popular development tools, but, oddly enough, has no analogues. Well, at least I could not find anything like that.
In this article I tried to focus less on technical details and compensate for this with an abundance of links. Those interested can watch the source code and ask questions. If any aspect seems interesting enough to the public, I can write a more detailed article about it.
I really hope that this extension will be useful to many. If someone wants to take part in the development of the project - write.
Links
- NativeViewer at SourceForge
- NativeViewer for Visual Studio 2010 in Visual Studio Extensions Gallery
- NativeViewer for Visual Studio 2012 in Visual Studio Extensions Gallery
- Debug in Visual Studio using NativeViewer
Source: https://habr.com/ru/post/161605/
All Articles