Building a social network graph using Drupal and Feeds
In one large university in the South of Russia, I am developing a software platform for automated graph construction of a social network using the processing of social networking web pages. In this article I will tell you how we processed data collected from LiveJournal (Livejournal.com).
Almost a year has passed, I think it will be interesting to know how the system was used for automated data collection during the election campaign to the State Duma in 2011.
To generate a table of references, the processing of social networking pages and the blogosphere (parsing) is implemented using the Feeds module for CMF Drupal with the SimpleHTMLDOMparser plugin. During the parsing process, the system accesses a page with information on the Internet and fetches data from the DOM of the HTML tree according to the set of tags and the cascading style sheet.
Consider the configuration of the module for importing user comments into the system. The system is designed in such a way that allows you to divide the collected information into elementary parts, each of which represents a separate field in the database. The import is made granular, which subsequently gives the opportunity to flexibly filter the results. The following data extractors (Extractions) are included in the data collection (see Fig. 1):
')
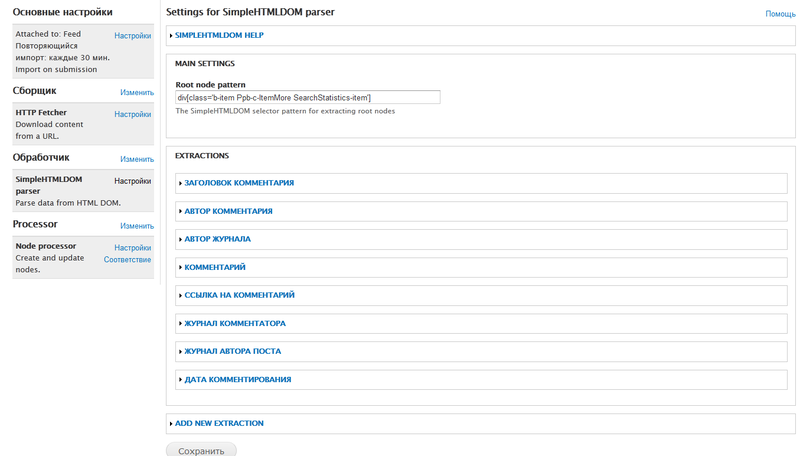
Fig. 1. - Data export settings in the Feeds module
Data retrieval is performed hierarchically:
In particular, for the “Comment Author” field it is necessary to set the pattern “ul [class = 'info b-hlist b-hlist-middot'] li a” with the attribute “plaintext”. This pattern provides immersion into the DOM HTML tree and exports all elements that are in the unordered list “ul” with the class “info b-hlist b-hlist-middot” and wrapped with the tag “a” (see Figure 2).
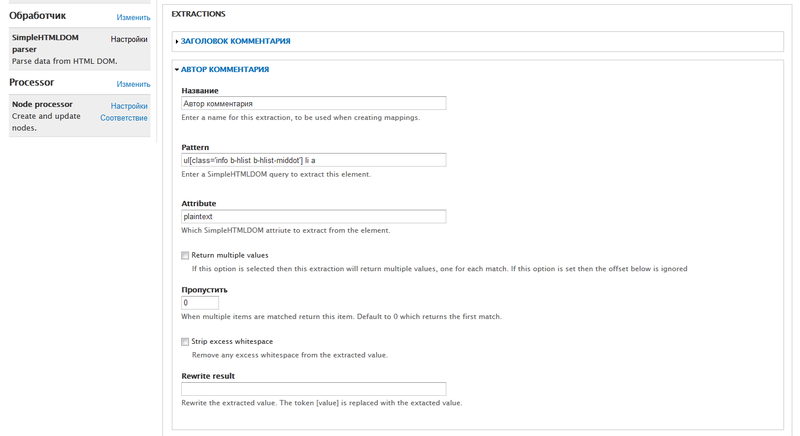
Fig. 2. - Setting the pattern and attributes of the "Comment By" field in the Feeds module
Each exported item in the system corresponds to the predefined fields of the type of material Feed item (feed instance). The correspondence table is shown in Fig. 3
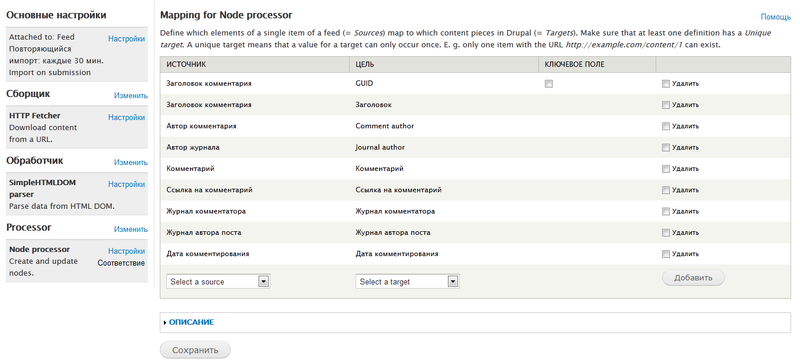
Fig. 3. - Setting the pattern and attributes of the "Comment By" field in the Feeds module
After setting all the necessary parameters, the system starts parsing for the selected keywords. As a result, the system will form a table with a set of data on comments, presented in Fig. 4: comment title, date of its import into the system, author of the comment, author of the blog to which the comment relates, text of the comment, date of its publication on the Internet, tonality (positive, negative, neutral), defined by the system user.
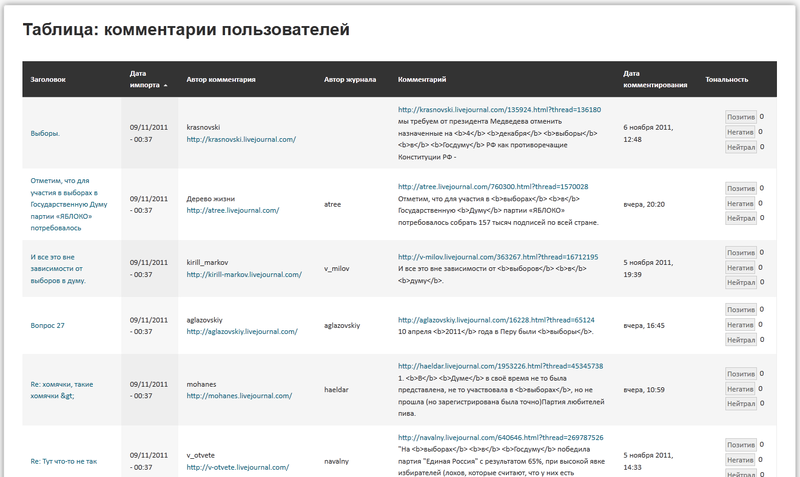
Fig. 4. - table with comments data
For further analysis of the graph, the generated table is exported to one of the supported formats. To export, use the XLS button below the table, fig. five.

Fig. 5. - table export buttons
During the export process, you can monitor its progress: the time it takes for the system to generate the file and the percentage of completion is displayed, pic. 6
Fig. 6. - data export process
The result of the export is a file that should be saved for further analysis of the graph, fig. 7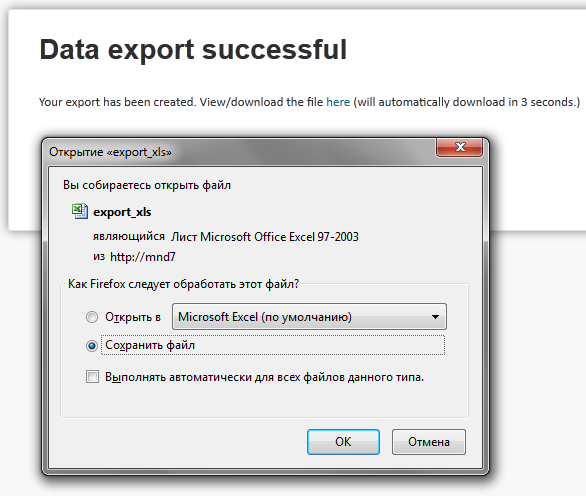
Fig. 7. - export result
Implementing a campaign monitoring technology using the developed model and using the described algorithm will be useful at different stages of monitoring social networks and the electoral process - both during election campaigns and between them.
It is also possible to use a system for collecting data and forming a graph in any areas of activity where the structure can be represented as a graph with clearly defined nodes and links between them.
Of course, you want to look at the graph?) This is the first article. In the next I will talk about the visualization and analysis of the resulting graph and the conclusions that we made before the well-known events of last December.
Almost a year has passed, I think it will be interesting to know how the system was used for automated data collection during the election campaign to the State Duma in 2011.
To generate a table of references, the processing of social networking pages and the blogosphere (parsing) is implemented using the Feeds module for CMF Drupal with the SimpleHTMLDOMparser plugin. During the parsing process, the system accesses a page with information on the Internet and fetches data from the DOM of the HTML tree according to the set of tags and the cascading style sheet.
Consider the configuration of the module for importing user comments into the system. The system is designed in such a way that allows you to divide the collected information into elementary parts, each of which represents a separate field in the database. The import is made granular, which subsequently gives the opportunity to flexibly filter the results. The following data extractors (Extractions) are included in the data collection (see Fig. 1):
- comment title;
- comment author - username on the network or blog;
- the author of the journal is the record to which the comment relates;
- comment - the actual text;
- link to comment;
- journal commentator;
- journal author of the post;
- Comment date - the current date when the comment was posted online.
')

Fig. 1. - Data export settings in the Feeds module
Data retrieval is performed hierarchically:
In particular, for the “Comment Author” field it is necessary to set the pattern “ul [class = 'info b-hlist b-hlist-middot'] li a” with the attribute “plaintext”. This pattern provides immersion into the DOM HTML tree and exports all elements that are in the unordered list “ul” with the class “info b-hlist b-hlist-middot” and wrapped with the tag “a” (see Figure 2).

Fig. 2. - Setting the pattern and attributes of the "Comment By" field in the Feeds module
Each exported item in the system corresponds to the predefined fields of the type of material Feed item (feed instance). The correspondence table is shown in Fig. 3

Fig. 3. - Setting the pattern and attributes of the "Comment By" field in the Feeds module
After setting all the necessary parameters, the system starts parsing for the selected keywords. As a result, the system will form a table with a set of data on comments, presented in Fig. 4: comment title, date of its import into the system, author of the comment, author of the blog to which the comment relates, text of the comment, date of its publication on the Internet, tonality (positive, negative, neutral), defined by the system user.

Fig. 4. - table with comments data
For further analysis of the graph, the generated table is exported to one of the supported formats. To export, use the XLS button below the table, fig. five.

Fig. 5. - table export buttons
During the export process, you can monitor its progress: the time it takes for the system to generate the file and the percentage of completion is displayed, pic. 6

Fig. 6. - data export process
The result of the export is a file that should be saved for further analysis of the graph, fig. 7

Fig. 7. - export result
Implementing a campaign monitoring technology using the developed model and using the described algorithm will be useful at different stages of monitoring social networks and the electoral process - both during election campaigns and between them.
It is also possible to use a system for collecting data and forming a graph in any areas of activity where the structure can be represented as a graph with clearly defined nodes and links between them.
Of course, you want to look at the graph?) This is the first article. In the next I will talk about the visualization and analysis of the resulting graph and the conclusions that we made before the well-known events of last December.
Source: https://habr.com/ru/post/161207/
All Articles