Cycle splitting as an example of high-level optimization

In the previous post, the main problems affecting performance ... I wrote that performance analysis is a complex task and cannot be solved in most cases without analyzing the source code, studying how this or that algorithm is implemented and without knowing the computational architecture, on which the application will run. In this post I want to show an example of optimizing a program based on the idea of breaking the loop.
')
The basic idea of cycle optimizations
Cycles are extremely important in computational programs and, as a rule, perform various cycles and are hot functions of the application, i.e. time-consuming functions when executed. The first computational architectures were mainly intended for high-performance computing with a wide use of various cycles, and therefore the idea of optimizing them has been in the minds of a very long time, and quite a lot has been proposed for various cycle optimizations. The basic idea of cycle optimization is to change the order of work performed. If, at the level of the computational kernel, the rearrangement of instructions serves to improve the performance of the computational pipeline, then when performing cyclic optimizations, the permutation of assertions is performed with more global goals, such as improving the performance of the memory subsystem, performing vectorization and auto-parallelization, improving instructional parallelism, reusing data, improving the branch predictor etc. Since there are a lot of different factors, the compiler should have a certain heuristic mechanism that assesses possible pros and cons and decides whether or not to do this or that high-level optimization.
A simple example of the effectiveness of cyclic optimizations
Consider a simple example with popular optimization of loop distribution (loop distribution), which is usually closely linked to inverse optimization of loop fusion, and see how optimization affects the performance of some synthetic test. The synthetic test is absolutely meaningless, but it will help to reveal certain patterns of operation of the computational core. Arrays are implemented as pointer vectors. Under the PERF macro, the initial large cycle is divided into three cycles, each of which contains a part of interrelated calculations from the initial cycle.
#include <stdio.h> #include <stdlib.h> #define N 1000 int main() { int i,j,rep; int volatile nnn; float **a1,**a2,**a3; float **b1,**b2, **b3; double **c1, **c2, **c3; double sum1,sum2,sum3; nnn = 2000; // upper bound for repeat loop .... // memory allocation and initialization for(rep=0;rep<nnn;rep++) { #ifndef PERF for(j=1;j<N-1;j++) for(i=0;i<N;i++) { sum1 = sum1 + (a1[j][i]+a2[j][i]+a3[j][i]); sum2 = sum2 + (b1[j][i]+b2[j][i]+b3[j][i]); sum3 = sum3 + (c1[j][i]+c2[j][i]+c3[j][i]); sum1 = sum1 - (a1[j-1][i]+a2[j-1][i]+a3[j-1][i]); sum2 = sum2 - (b1[j-1][i]+b2[j-1][i]+b3[j-1][i]); sum3 = sum3 - (c1[j-1][i]+c2[j-1][i]+c3[j-1][i]); sum1 = sum1 - (a1[j+1][i]+a2[j+1][i]+a3[j+1][i]); sum2 = sum2 - (b1[j+1][i]+b2[j+1][i]+b3[j+1][i]); sum3 = sum3 - (c1[j+1][i]+c2[j+1][i]+c3[j+1][i]); } #else for(j=1;j<N-1;j++) for(i=0;i<N;i++) { sum1 = sum1 + (a1[j][i]+a2[j][i]+a3[j][i]); sum1 = sum1 - (a1[j-1][i]+a2[j-1][i]+a3[j-1][i]); sum1 = sum1 - (a1[j+1][i]+a2[j+1][i]+a3[j+1][i]); } for(j=1;j<N-1;j++) for(i=0;i<N;i++) { sum2 = sum2 + (b1[j][i]+b2[j][i]+b3[j][i]); sum2 = sum2 - (b1[j-1][i]+b2[j-1][i]+b3[j-1][i]); sum2 = sum2 - (b1[j+1][i]+b2[j+1][i]+b3[j+1][i]); } for(j=1;j<N-1;j++) for(i=0;i<N;i++) { sum3 = sum3 + (c1[j][i]+c2[j][i]+c3[j][i]); sum3 = sum3 - (c1[j-1][i]+c2[j-1][i]+c3[j-1][i]); sum3 = sum3 - (c1[j+1][i]+c2[j+1][i]+c3[j+1][i]); } #endif } printf("%lf %lf %lf \n",sum1,sum2,sum3); ... //deallocation } I will use the Intel compiler with the –O1 option. About this option, the compiler says (icl –help):
/ O1 optimize for all speeds
In fact, with this option, the compiler does not do cyclic optimizations, including auto-vectorization. Therefore, he will not interfere with the proposed experiment.
As a result of compilation with and without the –DPERF option, two executable files will be created.
icl -O1 distr.c -Fedistr.exe
icl -O1 -DPERF distr.c -Fedistr2.exe
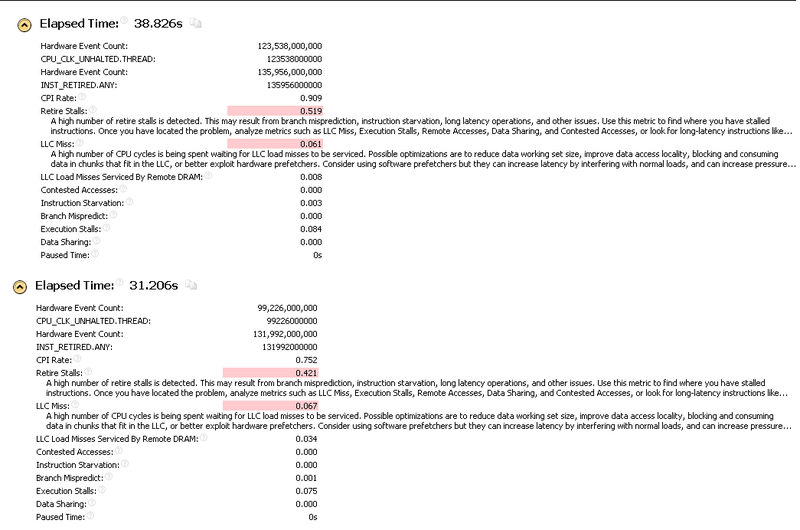
On my lab machine with Windows Server 2008 R2 Enterprise and the Intel Xeon X5570 processor, the execution time of the resulting tests is as follows:
distr.exe: 38.8 sec
distr2.exe: 31.2 sec
The performance of the second cycle is much better. Let's look at the General Exploration program made by Intel VTune Amplifier XE2013 and compare the results for both programs.
I wonder what's the matter?
There is a special guide “Performance Analysis Guide for Intel @ Core TM i7 Processor and Intel @ Xeon TM 5500 processors” in which you can study the methods of analyzing the operation of the computational core. VTune Amplifier also contains a brief description of various events. Therefore, if there are questions on the meaning of some of the names given here, then you can refer to this information. I will also be happy if someone corrects me or gives additional ideas about how the cycle optimization shows this effect.
When comparing reports, it may be noted that INST_RETIRED.ANY is approximately the same in both variants of the program. Those. no miracles happened here (like vectorization) and the amount of work done in both cases is approximately equal. But at the same time in the optimized version of the CPI Rate is much better and you need to understand at the expense of what happened.
The appearance of LLC Load Misses Serviced By Remote DRAM in one of the program variants is interesting. In theory, this problem is typical for multi-threaded applications and is associated with the use of a computational core of memory belonging to another core, which is typical of computing architectures with non-uniform memory access (NUMA). In this case, this situation arises due to the migration of the computational process along different computational cores. The stars were such that the second program migrated to the computational cores less successfully. You can bind the program to a specific computational core, so that these operating system triggers between cores do not affect the results. The following experiments are made with reference to a specific core.
I will not use the standard Memory Access analysis, various events for which are defined for the Nehalem architecture in VTune Amplifier, but I will take and compose my own set of events and compare them for two modifications of my program. I got about the following analysis:
It is surprising that the number of loads from memory has changed (MEM_INST_RETIRED.LOADS). However, if we compare the assembler of both variants of the program, then the number of instructions for working with memory in the original version is really more. This is due to the fact that when working simultaneously with a large number of arrays, there are not enough registers for storing intermediate results and there is a constant exchange between the program stack and the registers. Probably, this problem should not be critical, since the stack will be in the cache due to constant use.
If we recall the organization of the memory subsystem, then the computational core has an L1 data cache of 32KB in size. In the original version of the program at each iteration we work with a large number of different data streams. Those. at each iteration we need to read data from 27 places a1 [j-1] [i], a1 [j] [i], a1 [j + 1] [i], a2 [j-1] [i], ..., c1 [j + 1] [i]. But part of this data must be loaded into the cache subsystem at the previous iteration of j. New data is loaded for a1 [j + 1] [:], a2 [j + 1] [:], a3 [j + 1] [:], b1 [j + 1] [:], ..., c3 [ j + 1] [:]. The size of float is 4 bytes, the size of double is 8 bytes. The number of elements in the row of the matrix -1000. We get that 4000 * 3 + 4000 * 3 + 8000 * 3 = ~ 47KB of data should be placed in the cache subsystem at each iteration. Obviously, in the original version of the program, the L1D cache is completely updated at each iteration. In the modified version, at each iteration, ~ 12KB for real matrices and ~ 24KB for real double precision are updated, i.e. The data read at previous iterations should be partially stored in memory. This can be seen by comparing the ratio of L1D_CACHE_LD.I_STATE events (cache misses) to L1D_CACHE_LD.MESI (total number of cache accesses). In the “slow” version, this ratio is ~ 13.6%. In the “fast” version - ~ 7%. As a result, the modified version has fewer delays with long waiting times.
The performance of this computation should also be influenced by hardware prefetching devices. There are prefetchers that work with the L1 and L2 cache. From the documentation you can learn that they are not omnipotent and on different architectures support a different number of data streams. Referencing a specific array line, such as a [j] [i], is such a data stream. After reaching a certain number of simultaneously served threads, flows should appear for which the prefetch does not work. Moreover, it is possible that with a large number of threads, hardware prefetching will generally stop working. Therefore, I created a new kind of analysis in which I placed events related to the operation of L1D and L2 hardware prefetching devices:
In my opinion, this analysis shows the following. The number of requests (L1D_PREFETCH.REQUESTS) that are generated by the L1D prefetch device in the “good” case is even higher than the similar indicator in the “slow” case. Although it is strange, it confirms with a reserve the idea that the prefetcher is limited in its ability to serve data streams. As for prefetch devices for L2 cache, there are two interesting events L2_DATA_RQSTS.DEMAND.MESI (L2 data demand requests) and L2_DATA_RQSTS.PREFETCH.MESI (All L2 data prefetchers).
Those. Some of the memory accesses are served by the prefetch device, and the second part of the memory accesses is a surprise for the computational core. And here again there is an interesting picture. In the “good” case, the prefetcher creates significantly more forward requests. It is also important that the “bad” case is almost twice the number of requests that are not served by the prefetch device.
A pair of cycle optimization of the union / partition of cycles depends on the mass of conditions. It is likely that in the case of small arrays that are well placed in the cache, the first option would be faster due to the presence of a larger number of independent calculations at each iteration and by reducing the branching. In this case, the analysis is greatly simplified due to the fact that we know the size of the arrays, we know the computing system on which the experiment is being conducted, etc.
And what does the compiler do in this case?
The time has come to check, and what the optimizing compiler Intel does in this case. To put us on an equal footing, we’ll take the ability of the vector compiler to take away from the compiler. (Here you want to put a wink smiley.)
icl -O2 / Qvec- distr.c -Fedistr_comp.exe
time distr_comp.exe
...
CPU time for command: 'distr_comp.exe'
real 41.799 sec
So here's the compiler with the –O1 option that shows better performance than with –O2. It's not entirely clear how the test was optimized. There is an option / Qopt_report. If you use it, you can see that the compiler did a split loop:
LOOP DISTRIBUTION in _main at line 54
With the help of additional analysis (the ability to use dumps), it is possible to understand how the partition was approximately done:
for(j=1;j<N-1;j++) { for(i=0;i<N;i++) { sum3 = sum3 + (c1[j][i]+c2[j][i]+c3[j][i]); sum3 = sum3 - (c1[j-1][i]+c2[j-1][i]+c3[j-1][i]); sum3 = sum3 - (c1[j+1][i]+c2[j+1][i]+c3[j+1][i]); } for(i=0;i<N;i++) { sum1 = sum1 + (a1[j][i]+a2[j][i]+a3[j][i]); sum2 = sum2 + (b1[j][i]+b2[j][i]+b3[j][i]); sum1 = sum1 - (a1[j-1][i]+a2[j-1][i]+a3[j-1][i]); sum2 = sum2 - (b1[j-1][i]+b2[j-1][i]+b3[j-1][i]); sum1 = sum1 - (a1[j+1][i]+a2[j+1][i]+a3[j+1][i]); sum2 = sum2 - (b1[j+1][i]+b2[j+1][i]+b3[j+1][i]); } } I call such situations “grief from mind”. Obviously, on the one hand, the compiler has a creative potential. He figured out and chose dependent calculations in one group. But for some reason I limited myself to splitting the inner loop, nullifying all possible benefits from improving the locality of the data with which this loop works. The number of different transitions has increased, and the improvement in data locality with such optimization has not been achieved. The second cycle looks cumbersome in terms of estimating the number of data streams.
In order to somehow sweeten the compiler this bitter pill, let's see what auto-vectorization will give in this case:
icl -O2 distr.c -Fedistr_compvec.exe
CPU time for command: 'distr_compvec.exe'
real 24.020 sec
Conclusion:
In this small study, I just tried to hint that performance analysis is a rather interesting and intricate occupation. The number of factors affecting the speed of the program is quite large. It is very difficult to assess the contribution made to the program's performance by this or that factor, even if you have the ability to measure various in-processor events. In theory, to obtain an optimal result, the heuristic compiler mechanism should analyze a mass of some regularities, and this does not include the difficulty of proving the validity of a particular optimization. At the same time, the compiler often has no idea about the data with which the program will work and about the computing system on which this program will run.
Source: https://habr.com/ru/post/161155/
All Articles