HOLO - The Music Amalgamation System
 HOLO is a prefix from the Greek ὅλος, “all”.
Introduction
Not without excitement, I am glad to present to your attention my own development, which makes it possible to combine the music library into a single whole in order to search for “similar” music.
A few years ago, at the peak of the independent study of MATLAB, I wanted to create a program that would allow me to find other compositions “in the same spirit” for a given pattern of music. A bunch of good reasons were forced to postpone the implementation further and further, but at some point the matter moved from the dead point. As a result, slightly changing the basis for development, the first version of the program was made.
Formulation of the problem
So, the statement of the problem is as follows:
- There is a relatively large (> 10 thousand files) music collection on the hard disk, which became difficult to use and catalog, which is why many songs never get into the playlist for months and years.
- It is necessary to evaluate the numerical characteristics of the compositions, without using any information other than the form of the sound wave contained in the file (no file names, albums, id3 tags, etc. are not taken into account).
- Give the analyzer an input of one or more compositions as samples.
- List the compositions that do not coincide with the list of samples and are sorted in ascending order of their “distance” from the samples.
The development platform was C #, as the most simple language for me personally, fast enough and having a good development environment. A quick search on Codeplex and similar sites made it possible to avoid the invention of some bicycles, in particular, the following libraries are used:
- NAudio - for reading audio files.
- Meta.Numerics - for FFT-conversion.
- SQLite + SQLite netFX wrapper for storing and processing data.
- Also at the research stage, the ALGLIB library in the version for .NET is connected.
Architecturally, the program consists of two subsystems - the formation of a database on the music collection and a database search system.
Theory
Database formation is implemented as follows:
The analyzed file is represented as a vector from samples, from which N snapshots (snap) of length L samples are extracted, each of which is given in the fft-snap frequency response using the FFT transform . This transformation, in effect, turns the time series into a set of amplitudes of different frequencies that make up the time series. Then the fft-snap is proportionally compressed by K times (downscale ratio) in order to reduce the number of frequencies analyzed in the future.
Further, each frequency of the resulting set of images is considered separately - statistical characteristics are calculated, such as mean (mean), median (median), standard deviation (stdev), skewness and slope ( kurtosis ). As a result, for each composition we have a set of L / 2K frequencies (FFT is almost symmetrical with respect to the middle), for each of which 5 statistics are calculated. The file is put in the database, the path to it on the disk and 5L / 2K real numbers, each of which is labeled with the name of the statistics that it represents.
For example, we analyze a file by taking 40 pictures of 64,000 samples in length, compressed 1000 times. As a result, we have a vector of 5 * (64000/1000) / 2 = 160 numbers for each composition.
At this, the main stage of forming a database for analysis is considered complete. Auxiliary steps are:
- Building an index on the statistics table.
- Calculation of overall values for each statistic (maximum, minimum, average and corridor - the difference between maximum and minimum).
Now you can start the analysis. The simplest way to estimate the proximity of two points in a 160-dimensional space is to calculate the Euclidean distance between them (the sum of squares of pairwise differences of the corresponding statistics, we do not extract the square root - it lengthens the calculation, but does not affect the sorting result). It would seem - take it and count, but different frequencies in the frequency response of the composition have different scatter and the distance calculation "in the forehead" will give a distorted distance, with a strong emphasis on low frequencies. In order to compensate for the undesirable effect, we divide the squared difference between the values by the square of the average amplitude of a given frequency. Thus, the initially anisotropic space of the characteristics of the frequency distribution in which we calculate the distance becomes much more isotropic, that is, homogeneous.
Theoretically, it is possible to carry out a cluster analysis that combines the compositions according to their proximity, but so far it was decided to abandon the use of this method, since it is also based on calculating the distance between points in space (with a choice of different metrics), but the algorithm turns out to be more complicated and not very useful in the task of sorting songs by increasing distance.
Practice
Perhaps, the theory is still enough, I will tell you about the practical results based on my music collection. The number of tracks is 30277, the most varied genres - classical music, rock, hard rock, ambient, drum'n'bass, house, techno, ethnic, the whole range of metal from easy thinking to the most nuclear and fast.
The analysis of my entire collection took two and a half days, the database without post-processing takes 180 megabytes, together with the indices - 460.
The program interface in the search part is the dynamic generation of a SQL query, which implements the Euclidean distance calculation algorithm for the normalized statistics for each frequency.
It is possible to specify as one composition as a sample, as well as several. In general, the ability to search for songs that are close to several samples at once greatly increases the accuracy of the search, since one composition may have parasitic variations in statistics, arising for different reasons, but leveled due to the fact that several samples essentially form a centroid in multidimensional space, the parasitic variations of which are greatly reduced. The main thing in determining several samples is to be sure that there is indeed a clear commonality between the samples (for example, compositions from one album or in one narrow genre, etc.). If the samples are very different among themselves, then the issuance of close compositions will be irrelevant.
The request for one sample is performed on average about a minute, with an increase in the number of samples, the time increases proportionally.
A sample SQL looks like this:
select b.id, sum(((a.statvalue - b.statvalue)*(a.statvalue - b.statvalue))/(c1.value*c1.value)) as distance, 10000*max((a.statvalue - b.statvalue)*(a.statvalue - b.statvalue)/(c2.value*c2.value)) as maxdiff, 10000*avg((a.statvalue - b.statvalue)*(a.statvalue - b.statvalue)/(c2.value*c2.value)) as meandiff from stats a, stats b, feature c1, feature c2 where a.id in (631, 1919) and b.id not in (631, 1919) and a.statname = c1.statname and c1.feature = 'mean' and a.statname = c2.statname and c2.feature = 'max_min' and a.statname = b.statname and c1.statname = c2.statname and a.statvalue <= b.statvalue + 75*c2.value/100 and a.statvalue >= b.statvalue - 75*c2.value/100 and a.statname in ('b_median_FFT1_01', 'b_median_FFT1_02', 'b_median_FFT1_03', 'b_median_FFT1_04', 'b_median_FFT1_05', 'b_median_FFT1_06', 'b_median_FFT1_07', 'b_median_FFT1_08', 'b_median_FFT1_09', 'b_median_FFT1_10', 'b_median_FFT1_11', 'b_stdev_FFT1_01', 'b_stdev_FFT1_02', 'b_stdev_FFT1_03', 'b_stdev_FFT1_04', 'b_stdev_FFT1_05', 'b_stdev_FFT1_06', 'b_stdev_FFT1_07', 'b_stdev_FFT1_08', 'b_stdev_FFT1_09', 'b_stdev_FFT1_10', 'b_stdev_FFT1_11', 'b_skewn_FFT1_01', 'b_skewn_FFT1_02', 'b_skewn_FFT1_03', 'b_skewn_FFT1_04', 'b_skewn_FFT1_05', 'b_skewn_FFT1_06', 'b_skewn_FFT1_07', 'b_skewn_FFT1_08', 'b_skewn_FFT1_09', 'b_skewn_FFT1_10', 'b_skewn_FFT1_11', 'b_kurto_FFT1_01', 'b_kurto_FFT1_02', 'b_kurto_FFT1_03', 'b_kurto_FFT1_04', 'b_kurto_FFT1_05', 'b_kurto_FFT1_06', 'b_kurto_FFT1_07', 'b_kurto_FFT1_08', 'b_kurto_FFT1_09', 'b_kurto_FFT1_10', 'b_kurto_FFT1_11') group by b.id having maxdiff <= 100 and meandiff <= 64 order by distance limit 30; ')
As an example, I’ll give the result of a query from three samples of songs taken from the album “Songs of Darkness, Words of Light” by My Dying Bride :
These compositions are a good example of the death-doom metal genre.
Let's see, the issue size of 30 compositions is as follows:
Plus 3 more irrelevant tracks and 1 duplicate of what is already on the list. In my opinion, already quite acceptable. In any case, I would not reject such a playlist if I wanted to listen to something “in the spirit of MDB”.
- FUBAR - Crawling Relevance, perhaps, only on the texture of guitar sound.
- The Soundbyte - The Dark A lot of electronics, but the atmosphere is a great coincidence.
- AHAB - Ahabs Oath To the Point!
- Gorement - Into Shadows Slightly more extreme than the sample, is nevertheless very close.
- Tombs - Marina Abstract sludge doom, similar in texture.
- Esoteric - Allegiance To the point!
- Autechre - Eutow A very unexpected option, but if you listen, you can feel the parallels in the texture of sound.
- Entombed - Retaliation Not to the point, but very close.
- Quake Mission Pack 1 - Scourge of Armagon - 04-music-track-4.mp3 A ridiculous option, but overall the relevance was high.
- Nile - Divine Intent The first part of the song to the point, further sounds more intense than the samples.
- Amber Tears - For the Edge of Heaven To the point!
- NEUROSIS - Times of grace Slightly different genre, but relevance is high.
- Young Widows - In and Out Of Youth High relevancy.
- Empyrium - Autumn Gray Views Also Doom Metal.
- Dark Tranquility - Hours Passed In Exile More extreme, but relevance is good.
- Shape of Despair - Quiet These Paintings Are to the point!
- Rosetta - A Determinism of Morality High relevance.
- Solstafir - Ghosts of Light Very high relevance.
- Led Zeppelin - Ten Years Gone An unexpected option, but generally accepted as well.
- Typhus - *** CENSORED *** Relevance is high, the title of the track is censored as indecent for the site.
- Voivod - Divine Sun Relevance is acceptable.
- Cradle of Filth - Malice Through The Looking Glass A very good, albeit unexpected, option.
- Suffocation - Redemption Relevance deteriorates due to greater extremity.
- Nihilist –Abnormally Deceased Coincidence of guitar sound.
- Reverend Bizarre - The Gate of Nanna !
- Goresleeps - Avalon Dreams (The Voice From Legend) To the point!
Plus 3 more irrelevant tracks and 1 duplicate of what is already on the list. In my opinion, already quite acceptable. In any case, I would not reject such a playlist if I wanted to listen to something “in the spirit of MDB”.
I could cite other examples, but on the whole I want to say that the most simple to identify genre for the program is ambient (Aidan Baker, Tetsu Inoue, Lustmord and others, thousands of them).
disadvantages
Of course, they also exist, primarily because the comparison algorithm is far from perfect.
- The program does not take into account the average volume. Therefore, by the way, songs of the 80s can come out in the issue, while a sample from the 2000s, when the war of loudness was already coming to an end.
- According to my database, regularly appear irrelevant compositions from a limited list, the presence of which I cannot explain in the results so far. For such cases, an exception list has been made.
- In my opinion, the main file - the program almost never produces songs from the same album, if several have already been taken as a sample. In rare cases, one or two, no more.
- A similar drawback is to bring out all the songs, say, Zemfira, setting as a sample two or three of her own songs. The voice, of course, is a distinctive feature, but background instruments that sound differently in different compositions will violate the conditions for a favorable search. Perhaps, if we increase the resolution of the analysis by frequencies and add the number of samples for each song, then we can hope for something, but then the speed of work can drop dramatically.
- The central moments of the Nth order generally describe the compositions quite well, but two of them (skewness & kurtosis) are difficult to attach to the audible characteristics of the sound. Maybe this is not so bad, but I would like to have more understandable metrics.
- Speed of work: an average of a minute of waiting for each track in the list of samples is generally tolerable, but I would really like to be faster. The current request architecture with sorting in ascending order inevitably forces SQLite to do a full run of all compositions, despite the presence of indices, disabling the sorting can speed up the work many times over. By the way, in the case of work without sorting, additional methods for selecting options are provided.
Sources posted on Github . (Somehow I managed to make a push to the repository, for the first time in my life, eheheh. Those who want to help with the calculation - I ask in the PM, I need a little consultation)
For those who do not want to mess with the githab, laid out the binaries on google drive. You need to press Ctrl + S to save the archive yourself.
According to the first users, it became clear that not everyone has the ACM-codec MP3, because of this, the files may not be processed. Not sure, but most likely the installation of the K-Lite Codec Pack should help, for example.
I ask you strongly not to judge strictly, everything is done on enthusiasm. C # programming is not my main professional occupation.
The program can save and open a playlist, by double-clicking from the list of samples and the list of results, tracks can also be opened for listening.
If there are willing to help with the optimization of the SQL query or the formulation of additional metrics other than the ones described above, write personal messages, I will be glad to cooperate.
If there are any errors when trying to start the program - especially write, I will try to help with everything.
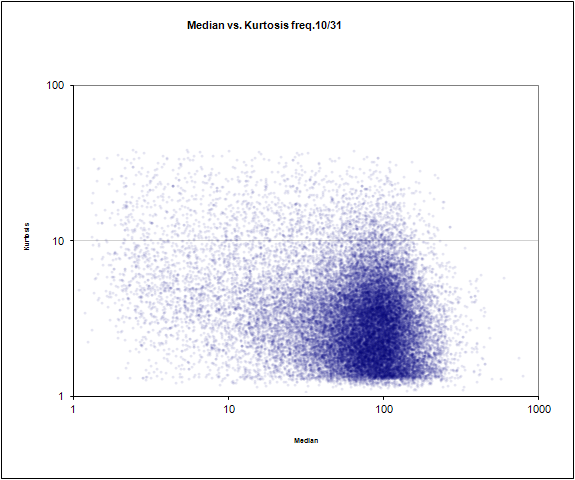
Bonus: some graphs based on the analysis of my collection
Median frequency number 10 of 31 against the slope
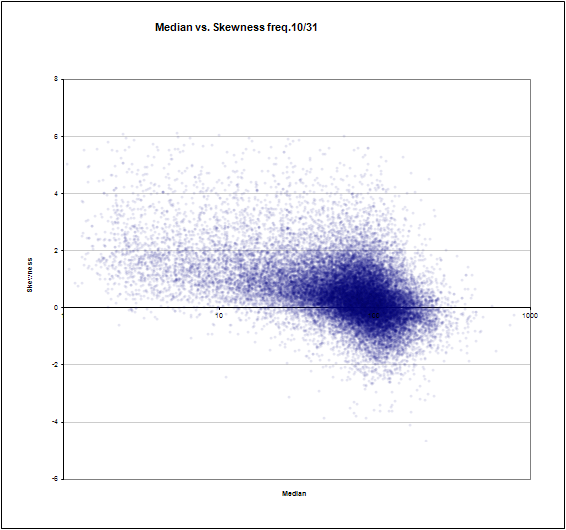
Median frequency №10 of 31 against bevel
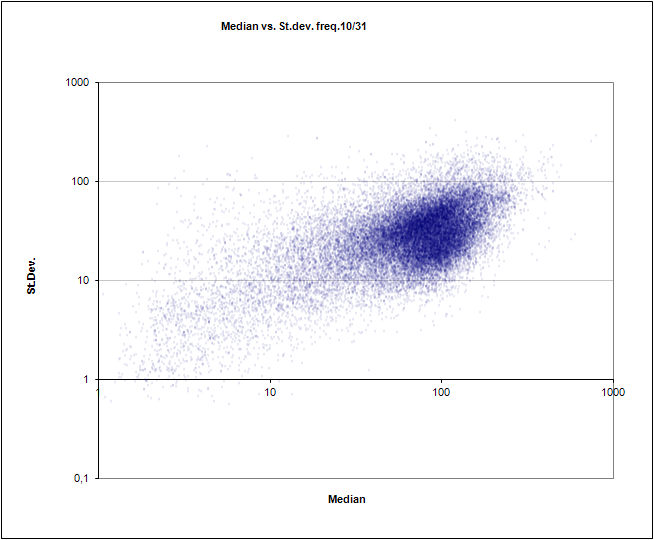
Median frequency # 10 out of 31 versus standard deviation
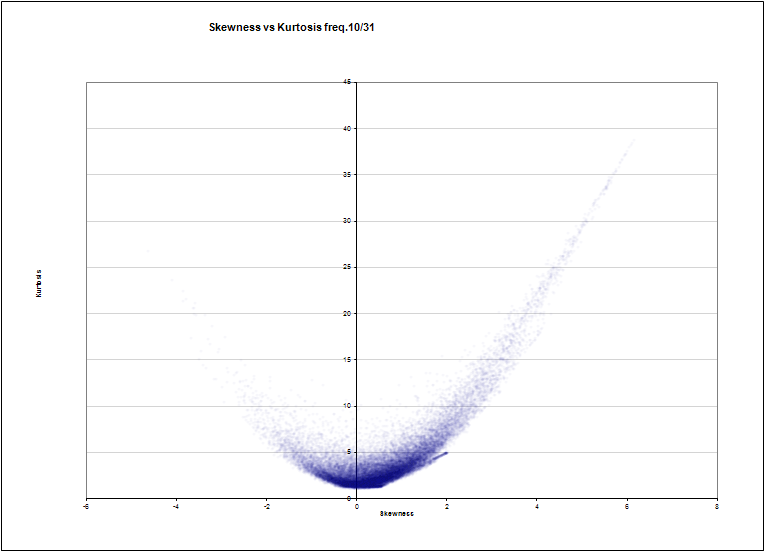
The slope of frequency number 10 of 31 against the bevel (the usual noisy parabola, is not it?)
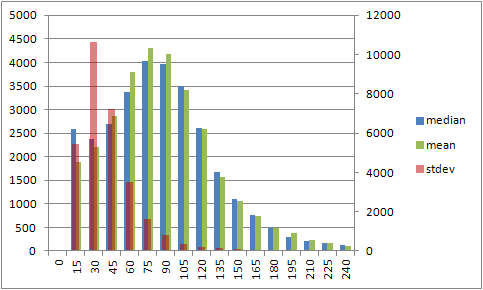
The histogram of the distribution of the average and median on the left axis and the standard deviation on the right
An example of the average value for all frequencies (was done for the base of 100 frequencies, normalized by the average value)

Graph of the smoothed bevel value for all frequencies (100 frequencies, normalized by the average value)

Median frequency №10 of 31 against bevel
Median frequency # 10 out of 31 versus standard deviation
The slope of frequency number 10 of 31 against the bevel (the usual noisy parabola, is not it?)
The histogram of the distribution of the average and median on the left axis and the standard deviation on the right
An example of the average value for all frequencies (was done for the base of 100 frequencies, normalized by the average value)
Graph of the smoothed bevel value for all frequencies (100 frequencies, normalized by the average value)
Source: https://habr.com/ru/post/161005/
All Articles