Example using Splunk for log analysis
Splunk is a system for storing and analyzing logs. In a nutshell, the principle of operation can be described as follows: there is a Splunk server that stores, indexes and allows you to analyze logs, and there are working machines (servers) that these logs create and transmit to the Splunk server. Splunk server, in turn, can be a cluster of several physical machines, between which the storage of information is distributed, and which are used for its processing according to the MapReduce technology. There are a lot of ways to transfer logs from working machines: through a special forwarder program that can quickly and efficiently send log changes to the server, using technologies like NFS / SMB or SNMP, you can send data to Splunk via TCP / IP yourself (for example, instead of to write to the file). Under Windows, Splunk can take data from Windows Events, Performance Counters or the Registry.
For Splunk, logs are textual information broken into lines. During the indexing process, log lines are broken down into fields, for example, “name = value”, although this is customizable. Then, using a special query language SPL, you can work with these fields: sort, aggregate, create calculated fields, form tables, access external dictionaries, for example, from a SQL database, and, of course, build various graphs. SPL works not only with single lines, but also allows you to group, “compress” logically in one line multi-line pieces.
As Splunk says, all the logs that are stored in the system at any time are available for queries, that is, there is no archiving concept. Of course, the machines (machines) where Splunk is spinning should reflect the amount of information stored and processed accordingly.
Splunk also calls himself “Google for logs,” but we will leave this statement without comment on their own mercy.
')
Splunk web interface. You can create panels (dashboards) from which to build your own Splunk application. Splunk has an app store (although most of them are free), where there is a sea of ready-made configurations for analyzing popular systems, for example, UNIX syslog, Apache logs, Microsoft Exchange, etc.
The Splunk software package can be downloaded free of charge from the official website. Licensing is based on the daily volume of logs pumped through the system. For review there is a minimum free volume, which is perfectly enough for the development of the system.
For quick reference I recommend the book Exploring Splunk from the creators of this product. Scrolling through it, you get a good initial understanding of what you can do in Splunk, the essence of the SPL query language, etc.
In this article, I want to show a real example that can be repeated in half an hour. It's enough free to download and install Splunk under your operating system. Then you can just follow my instructions.
An example would be unusual. Traditionally, logs are used to analyze historical information. But nothing prevents to extract it in the course of its appearance and to create “live” indicators based on it. I agree, my example is a bit artificial, but I want to show how quickly and simply you can “throw” the data into Splank, formalize them and build a dynamic user interface based on them
Here is a simple script that will log messages containing a percentage (from 0 to 100%) to the log for a minute.
The log will look something like this:
Our goal is to create a dashboard in the Splanka, which would display the process of executing the script in the form of a beautiful indicator, while taking data from the log.
For simplicity, we will do everything on one machine, and Splank will take the log simply from the specified file.
So, you have already installed Splank, and if you go to " http: // localhost: 8000 ", you will see the Splank work page, where you can log in as the "admin" user.
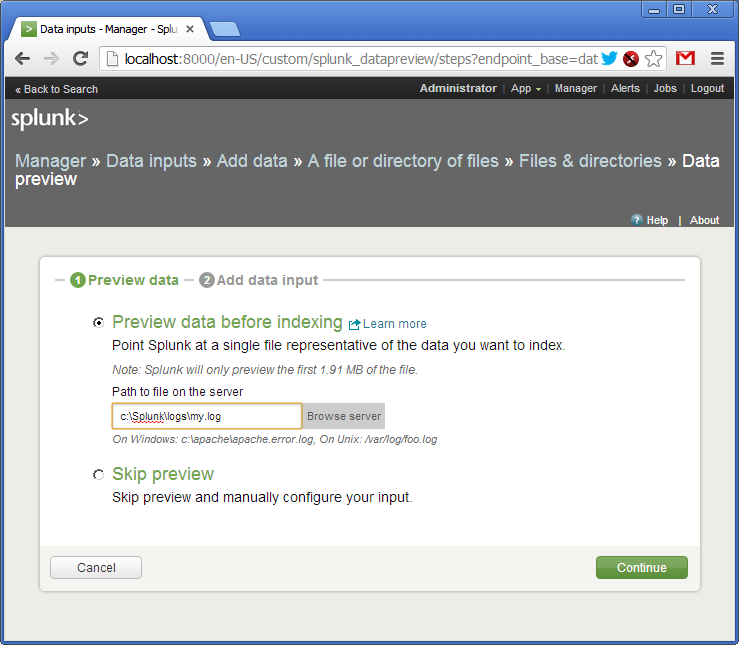
Next we go through the menu: “Manager -> Data Inputs -> Add data -> A file or directory or files”. Here we specify the name of the file or directory where our logs are located (in this case it will be a single file).
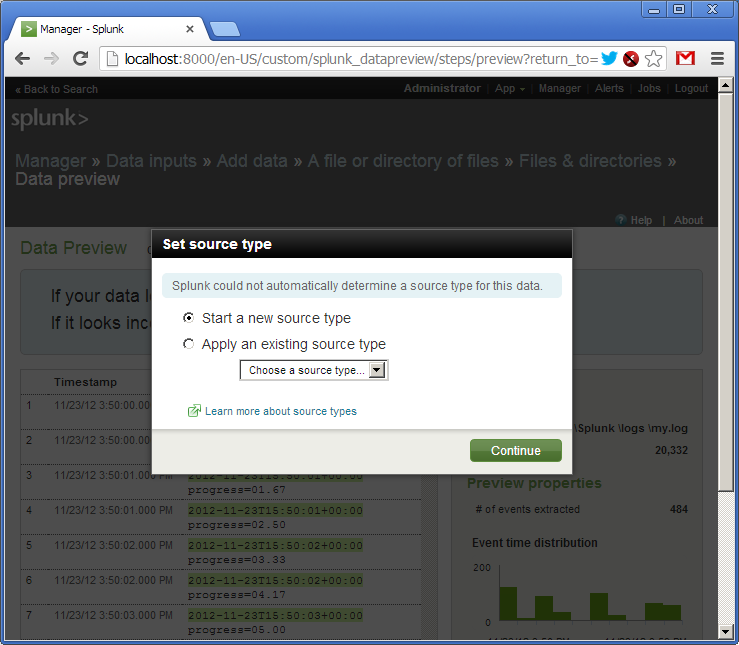
We confirm the creation of the so-called source of logs (source type). As I said, logs in Splank can flow in various ways. Each such source of logs is named and can be processed independently.
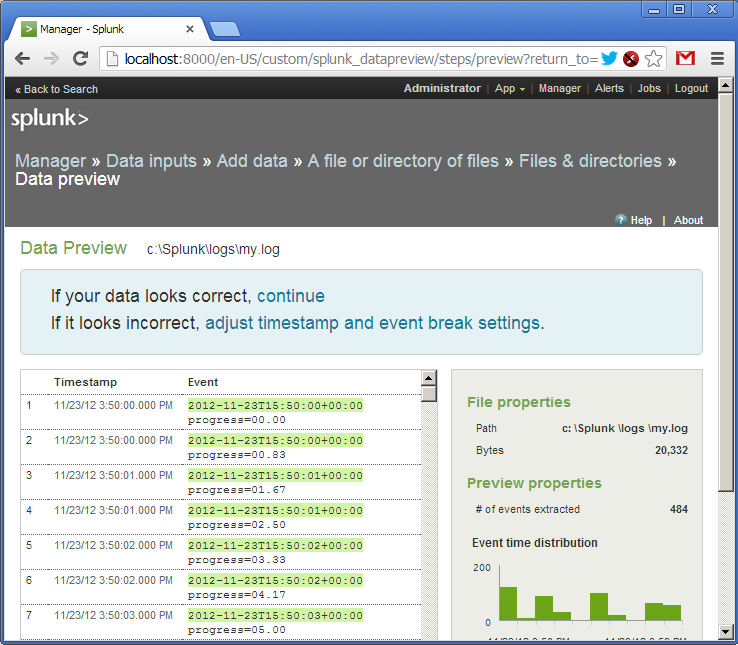
So, the log is added. We see that Splank "hooked" the file and already parsed the lines in the field. Splank understands a huge number of date and time formats, but it is also insistent.
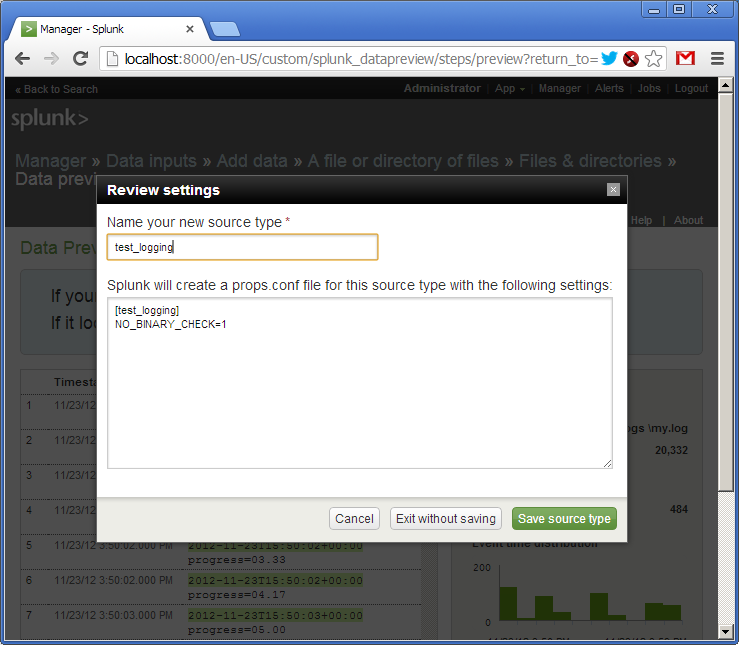
Next, we give the name of our source of the logs - “test_logging”, and save the settings.
Go back to the main page and in the Search line, enter our first SPL query (in red):
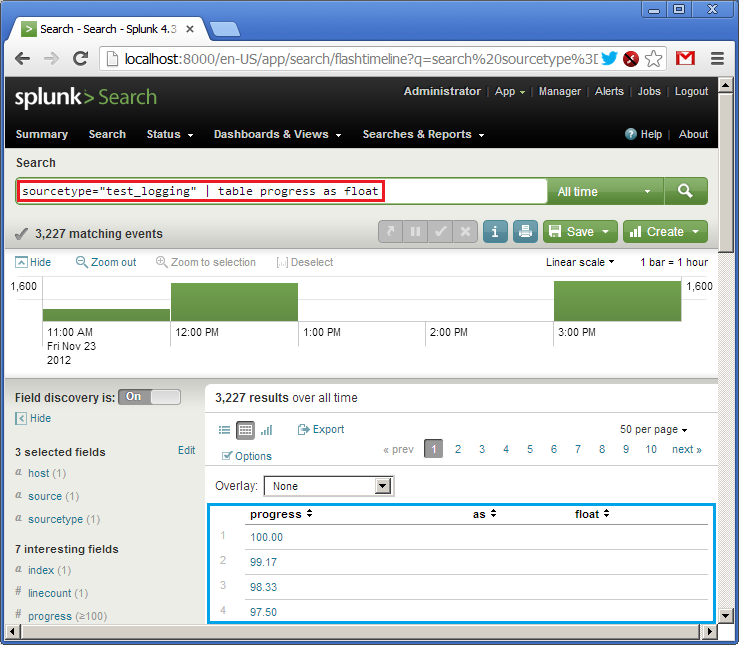
sourcetype = "test_logging" | table progress as float
I translate: take logs from the source “test_logging”, form a table in which to add a column with a value from the field “progress”, converting it to the float type. At the bottom (in blue) we see the result of the query (there is already data in the log). In SPL, the principle of UNIX pipes (|) works, when the result of one operation is passed to the input of the next.
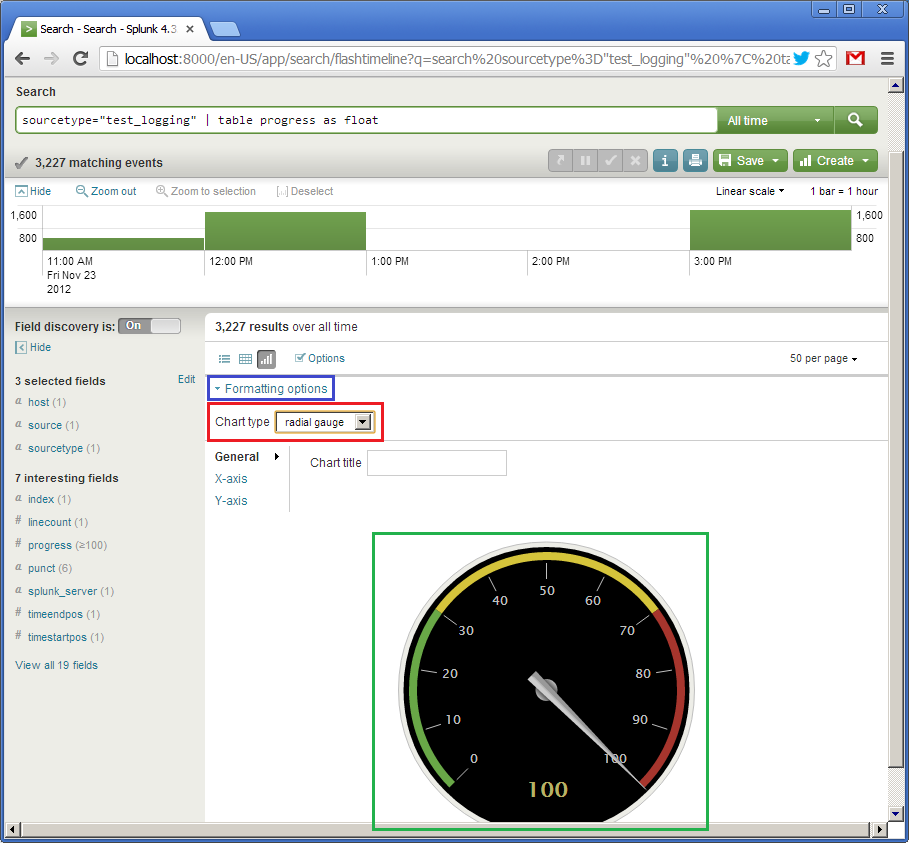
So, the table is. Now we will make her a graphical representation. Since we have only one field showing the percentage of completion from 0 to 100, for example, you can use the type of speedometer, the arrow of which will show the current value. Click on the “Formatting options” (in blue) and select the element type (Chart type) “radial gauge” (in red). There is such a beautiful speedometer.
The first widget is ready. Now for the sake of experiment we will create one more. It will also show the values of the progress field, but in the form of a horizontal indicator (progress bar), moving from left to right. The request in this case will be as follows:
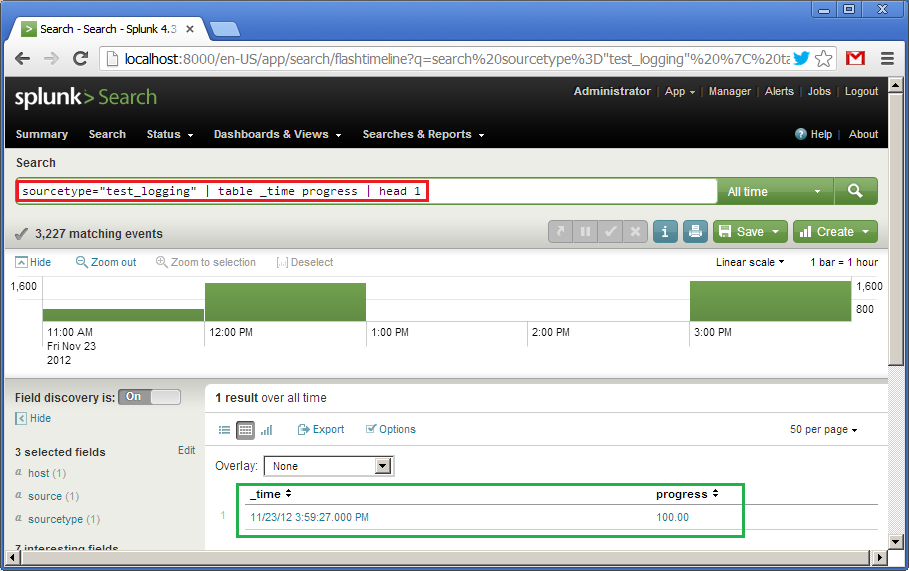
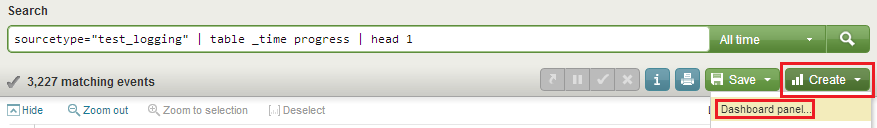
sourcetype = "test_logging" | table _time progress | head 1
What does it mean: according to the data from the source “test_logging”, create a table of two fields, “_time” and “progress”, from which only the first row should be taken. Sort by default by "_time" descending. Below (in green) we see the result of this query.
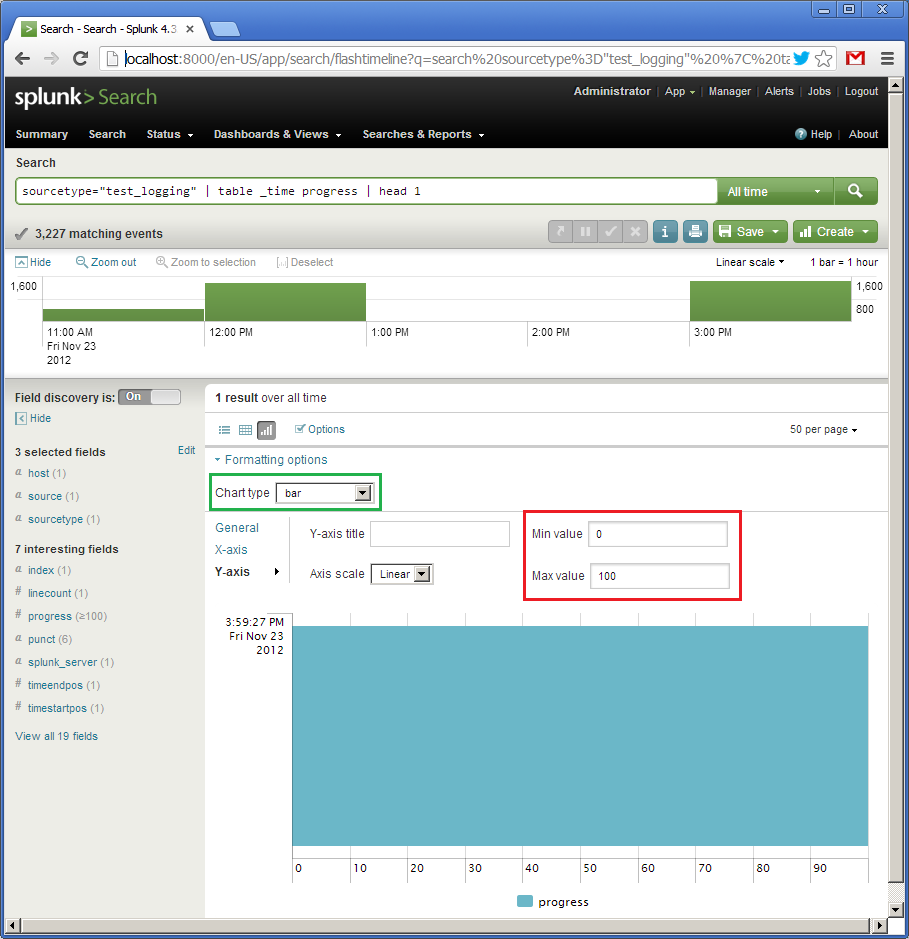
Next, click on “Formatting options”, select the type “bar” (in green), set the interval from 0 to 100 for the Y axis. For some reason, the X axis is vertically (the _time field will be displayed there), and the Y axis horizontally (the progress field will be displayed there). Since the request for the previous image showed the value of 100, then our horizontal indicator is completely shaded.
I missed it for the first widget, speedometer, but the debugged query and its visual presentation can be saved as a “Dashboard panel”. To do this, click on "Create" and "Dashboard panel ..." (in red) and save the settings. Let's call our first widget “Speedometer”, and the second “Progress bar”.
When saving the first widget, you will also be offered to create a panel (dashboard), let's call it “Test logging”. When you save the second widget, add its already created panel.
After creating the panel, you can click on “Dashboards & Views”, select it by the name “Test logging”. The appearance will be something like this:
There is no data yet, so the panels are empty. We see the name of the panel (in red), the names of the widgets (in yellow), the button for activating the panel (in green) and the “Edit” button (in blue), which can be corrected on the fly with a request or a visual presentation. Before launching the script, you need to go to each of the widgets via the “Edit” button and specify the update time interval in one second: from “rt-1s” (real time - 1s) to “rt” (current time).
So everyone! Clamp on "On" and run our script.
Video how it works:
Everything!
Of course, the example is very simple, but I hope I managed to convey at least a minimal sensation of how Splank works.
I will say that we in the company recently started using this product and are satisfied so far. This year I was at the SplunkLive conference, where people from very solid offices like British Telecom spoke. With Splunk, some process gigabytes of logs every day.
Alas, even large offices do not always have a desire to develop a subsystem for processing logs, so Splank may be very useful.
For Splunk, logs are textual information broken into lines. During the indexing process, log lines are broken down into fields, for example, “name = value”, although this is customizable. Then, using a special query language SPL, you can work with these fields: sort, aggregate, create calculated fields, form tables, access external dictionaries, for example, from a SQL database, and, of course, build various graphs. SPL works not only with single lines, but also allows you to group, “compress” logically in one line multi-line pieces.
As Splunk says, all the logs that are stored in the system at any time are available for queries, that is, there is no archiving concept. Of course, the machines (machines) where Splunk is spinning should reflect the amount of information stored and processed accordingly.
Splunk also calls himself “Google for logs,” but we will leave this statement without comment on their own mercy.
')
Splunk web interface. You can create panels (dashboards) from which to build your own Splunk application. Splunk has an app store (although most of them are free), where there is a sea of ready-made configurations for analyzing popular systems, for example, UNIX syslog, Apache logs, Microsoft Exchange, etc.
The Splunk software package can be downloaded free of charge from the official website. Licensing is based on the daily volume of logs pumped through the system. For review there is a minimum free volume, which is perfectly enough for the development of the system.
For quick reference I recommend the book Exploring Splunk from the creators of this product. Scrolling through it, you get a good initial understanding of what you can do in Splunk, the essence of the SPL query language, etc.
In this article, I want to show a real example that can be repeated in half an hour. It's enough free to download and install Splunk under your operating system. Then you can just follow my instructions.
An example would be unusual. Traditionally, logs are used to analyze historical information. But nothing prevents to extract it in the course of its appearance and to create “live” indicators based on it. I agree, my example is a bit artificial, but I want to show how quickly and simply you can “throw” the data into Splank, formalize them and build a dynamic user interface based on them
Here is a simple script that will log messages containing a percentage (from 0 to 100%) to the log for a minute.
require 'date' duration = 60*1 update_period = 0.5 i = 0 while i <= duration do progress = i * 100.0 / duration msg = "%s progress=%05.2f\n" % [DateTime.now, progress] puts msg open("logs/my.log", 'a') { |f| f << msg } i = i + update_period sleep update_period end The log will look something like this:
2012-11-23T15:58:54+00:00 progress=45.00 2012-11-23T15:58:55+00:00 progress=45.83 2012-11-23T15:58:55+00:00 progress=46.67 2012-11-23T15:58:56+00:00 progress=47.50 2012-11-23T15:58:56+00:00 progress=48.33 2012-11-23T15:58:57+00:00 progress=49.17 2012-11-23T15:58:57+00:00 progress=50.00 Our goal is to create a dashboard in the Splanka, which would display the process of executing the script in the form of a beautiful indicator, while taking data from the log.
For simplicity, we will do everything on one machine, and Splank will take the log simply from the specified file.
So, you have already installed Splank, and if you go to " http: // localhost: 8000 ", you will see the Splank work page, where you can log in as the "admin" user.
Next we go through the menu: “Manager -> Data Inputs -> Add data -> A file or directory or files”. Here we specify the name of the file or directory where our logs are located (in this case it will be a single file).
We confirm the creation of the so-called source of logs (source type). As I said, logs in Splank can flow in various ways. Each such source of logs is named and can be processed independently.
So, the log is added. We see that Splank "hooked" the file and already parsed the lines in the field. Splank understands a huge number of date and time formats, but it is also insistent.
Next, we give the name of our source of the logs - “test_logging”, and save the settings.
Go back to the main page and in the Search line, enter our first SPL query (in red):
sourcetype = "test_logging" | table progress as float
I translate: take logs from the source “test_logging”, form a table in which to add a column with a value from the field “progress”, converting it to the float type. At the bottom (in blue) we see the result of the query (there is already data in the log). In SPL, the principle of UNIX pipes (|) works, when the result of one operation is passed to the input of the next.
So, the table is. Now we will make her a graphical representation. Since we have only one field showing the percentage of completion from 0 to 100, for example, you can use the type of speedometer, the arrow of which will show the current value. Click on the “Formatting options” (in blue) and select the element type (Chart type) “radial gauge” (in red). There is such a beautiful speedometer.
The first widget is ready. Now for the sake of experiment we will create one more. It will also show the values of the progress field, but in the form of a horizontal indicator (progress bar), moving from left to right. The request in this case will be as follows:
sourcetype = "test_logging" | table _time progress | head 1
What does it mean: according to the data from the source “test_logging”, create a table of two fields, “_time” and “progress”, from which only the first row should be taken. Sort by default by "_time" descending. Below (in green) we see the result of this query.
Next, click on “Formatting options”, select the type “bar” (in green), set the interval from 0 to 100 for the Y axis. For some reason, the X axis is vertically (the _time field will be displayed there), and the Y axis horizontally (the progress field will be displayed there). Since the request for the previous image showed the value of 100, then our horizontal indicator is completely shaded.
I missed it for the first widget, speedometer, but the debugged query and its visual presentation can be saved as a “Dashboard panel”. To do this, click on "Create" and "Dashboard panel ..." (in red) and save the settings. Let's call our first widget “Speedometer”, and the second “Progress bar”.
When saving the first widget, you will also be offered to create a panel (dashboard), let's call it “Test logging”. When you save the second widget, add its already created panel.
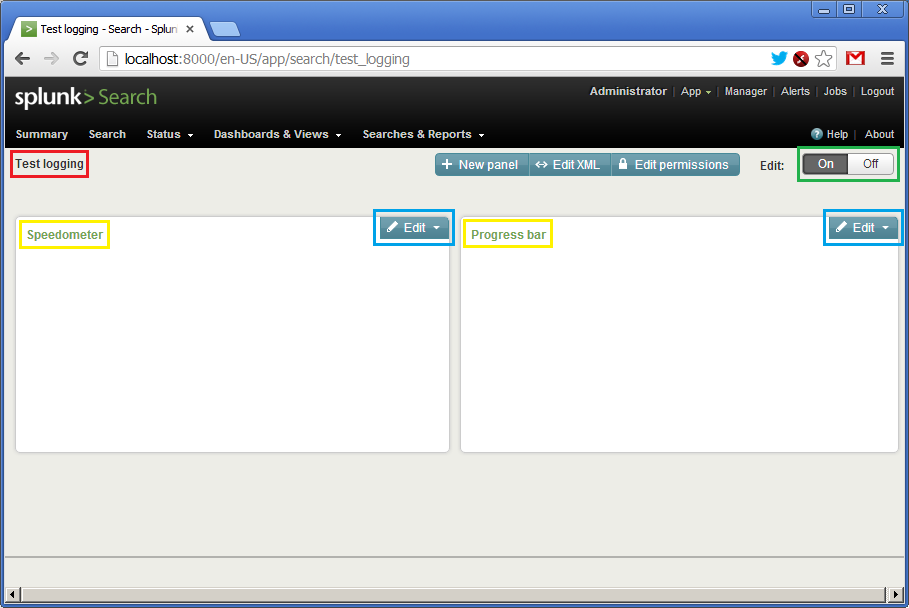
After creating the panel, you can click on “Dashboards & Views”, select it by the name “Test logging”. The appearance will be something like this:
There is no data yet, so the panels are empty. We see the name of the panel (in red), the names of the widgets (in yellow), the button for activating the panel (in green) and the “Edit” button (in blue), which can be corrected on the fly with a request or a visual presentation. Before launching the script, you need to go to each of the widgets via the “Edit” button and specify the update time interval in one second: from “rt-1s” (real time - 1s) to “rt” (current time).
So everyone! Clamp on "On" and run our script.
Video how it works:
Everything!
Conclusion
Of course, the example is very simple, but I hope I managed to convey at least a minimal sensation of how Splank works.
I will say that we in the company recently started using this product and are satisfied so far. This year I was at the SplunkLive conference, where people from very solid offices like British Telecom spoke. With Splunk, some process gigabytes of logs every day.
Alas, even large offices do not always have a desire to develop a subsystem for processing logs, so Splank may be very useful.
Source: https://habr.com/ru/post/160197/
All Articles