Analysis of the agglomeration of associated systems
Suppose you do molecular modeling. You have bulky path files in your hands, which would be nice to analyze how. Consider (and below will be discussed, mainly about this system), for example, methanol. We can, for example, build a radial distribution function (RDF), as is done in almost every such article. But, recalling that in methanol there is a specific agglomeration - hydrogen bonds - we may suddenly want to see, but how does it look there in reality. See how the agglomerates look (maybe even compare their topology), how they are distributed according to size or whatever you want. Actually, below I propose one of the options for implementing such a program.
The first is that it doesn’t matter what method you got the file paths - even QM, even MM, even if it’s a hybrid. The important thing is that you need to know the exact coordinates of the atoms. It does not even matter that it was a trajectory - you can use one snapshot of the trajectory, but statistics will suffer from this and, as a result, the results may be incorrect.
We now turn to the question of the definition of a hydrogen bond. It is proposed to determine the presence (or absence) of the hydrogen bond in several possible ways (as well as their combinations), for example:
As it is known, modern resources do not allow modeling of bulky systems (a la unit cell containing 1 mole of molecules), therefore it is necessary to use periodic boundary conditions . A real infinite system is replaced by a set of identical finite systems, each of which is located in a spatial cell surrounded on all sides by identical cells, and the molecules in one cell interact with the molecules in the neighboring ones. In reality, for such an analysis, it is not at all necessary for us to translate a cell in all directions, increasing the calculated space by 27 times (instead of one cell, we get 3 ^ 3 = 27). You can limit the broadcast to half the ribs in each direction. It is easy to show that in this case we will increase the calculated space just 8 times. At the same time, we can explicitly translate, scoring new coordinates into variables, or simply “bear in mind” the possibility of translation when analyzing. The first version is implemented in my program. In this case, by the way, it should be borne in mind that the bond with the molecule in the translated cell must be transferred to the molecule in the original cell .
')
The second question we can face is - what if we have a molecule with two functional groups? For example, for hydrogen bonds - ethanediol. Or even more fun - water. I propose to consider this possibility by introducing an additional label - the number of the molecule. That is, to operate not with separate groups, but with molecules at once.
The third problem is that such agglomeration can be observed not only in a system with OH groups, but also, for example, in chlorobenzene. I will not go into details of what, how and why, I will only note that a similar association is analogous to micelle formation in colloidal systems. In this case, we can analyze the chlorine-chlorine distances to determine whether the molecules are bound to associate.
I will make a couple of comments right away. The programmer out of my curve is a little more than full, because something can certainly be done better. At first I thought to bring a block diagram, but it turned out to be some kind of too cumbersome.
Initial data:
Algorithm to search for related molecules:
Algorithm output:
Then write out the arrays of agglomerates in any convenient form. At the end we add a block with general statistics (averaged over all points of the trajectory). You can additionally add statistics of bonds between, say, oxygen atoms.
The first is cross-analysis for the presence or absence of cycles in the associate. Without going into the evidence, I note that. if a molecule associated with one molecule is assigned a weight of 0, with two -1, etc., and then calculate the total weight of the graph (associate), then you can determine the number of cycles in the graph:
The second is much more fun. There are original articles - here and here . The point is that if we have two graphs, then we can compare whether they are isomorphic (in the sense of the same ± permutations) and determine the permutation from which one graph is obtained from the other. True, if my memory serves me, in these articles there were typos in the algorithms themselves, be careful.
With reference to our system, we can create a database of main graphs and check the resulting associates for compliance with a specific graph. Also, you can hold and statistics.
Unfortunately, I did not implement this block. There is only a program that checks two isomorphism graphs.
Well, the third. Analysis of a single molecule is the dynamics of its location in various agglomerates throughout the entire trajectory.
Source codes of programs can be taken by reference . Everything is implemented on C. Unfortunately, there are no comments in the code.
The STAT_GEN program works with the format of files similar to TINKER's trajectory files with one exception - there is no block corresponding to the connection of different atoms with each other, and a column indicating the number of the molecule is added.
The AGL program pulls out separate agglomerates from trajectory files and writes them into the PDB format.
The graph program analyzes the isomorphism of graphs.
Unfortunately, the performance of these programs on Windows after the transfer to LInux (originally written under Windows, because there is, for example, the library conio.h) was not checked, so I don’t know what it is and how.
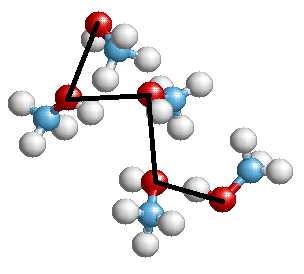
At the exit, you can get something like this image (from one of my presentations):
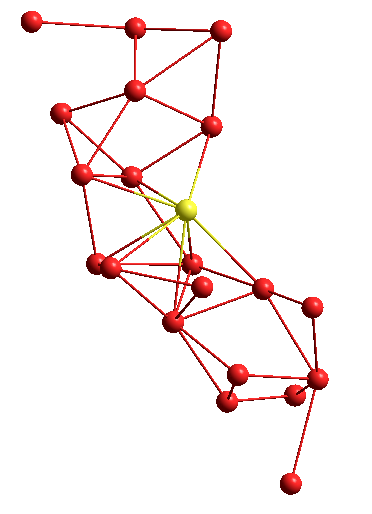
Or another structure, in the form of a graph:
Thanks for attention!
A bit of theory
The first is that it doesn’t matter what method you got the file paths - even QM, even MM, even if it’s a hybrid. The important thing is that you need to know the exact coordinates of the atoms. It does not even matter that it was a trajectory - you can use one snapshot of the trajectory, but statistics will suffer from this and, as a result, the results may be incorrect.
We now turn to the question of the definition of a hydrogen bond. It is proposed to determine the presence (or absence) of the hydrogen bond in several possible ways (as well as their combinations), for example:
- The distances between the oxygen atoms of different molecules and the hydrogen atom and the oxygen atom of another molecule must be less than the reference values.
- The distances between the oxygen atoms of different molecules and the HOO angle should be less than the reference values.
- Energy criterion
And what do we need to take into account?
As it is known, modern resources do not allow modeling of bulky systems (a la unit cell containing 1 mole of molecules), therefore it is necessary to use periodic boundary conditions . A real infinite system is replaced by a set of identical finite systems, each of which is located in a spatial cell surrounded on all sides by identical cells, and the molecules in one cell interact with the molecules in the neighboring ones. In reality, for such an analysis, it is not at all necessary for us to translate a cell in all directions, increasing the calculated space by 27 times (instead of one cell, we get 3 ^ 3 = 27). You can limit the broadcast to half the ribs in each direction. It is easy to show that in this case we will increase the calculated space just 8 times. At the same time, we can explicitly translate, scoring new coordinates into variables, or simply “bear in mind” the possibility of translation when analyzing. The first version is implemented in my program. In this case, by the way, it should be borne in mind that the bond with the molecule in the translated cell must be transferred to the molecule in the original cell .
')
The second question we can face is - what if we have a molecule with two functional groups? For example, for hydrogen bonds - ethanediol. Or even more fun - water. I propose to consider this possibility by introducing an additional label - the number of the molecule. That is, to operate not with separate groups, but with molecules at once.
The third problem is that such agglomeration can be observed not only in a system with OH groups, but also, for example, in chlorobenzene. I will not go into details of what, how and why, I will only note that a similar association is analogous to micelle formation in colloidal systems. In this case, we can analyze the chlorine-chlorine distances to determine whether the molecules are bound to associate.
Implementation
I will make a couple of comments right away. The programmer out of my curve is a little more than full, because something can certainly be done better. At first I thought to bring a block diagram, but it turned out to be some kind of too cumbersome.
Initial data:
- The coordinates of the atoms of interest to us (including those that have been translated), in the example with methanol, the oxygen atom and the associated hydrogen
- An array of tags indicating which molecule some functional group belongs to.
- 2 parameters - reference intermolecular distances OH and OO
Algorithm to search for related molecules:
- Two nested loops with iteration over all molecules (including those translated), the second loop, naturally, begins with the next molecule (why should we take the same thing two times into account?).
- We consider the distance between the oxygen atoms. For all groups in the molecules, we find the minimum among them. Check with the reference. If less, then go ahead.
- Implementation of the previous step, but for oxygen and hydrogen atoms. That is, we consider all possible (if on one oxygen, for example, two hydrogen - as in water) the distance between the oxygen atoms of the first molecule (determined at the previous step) and the hydrogen of the second molecule (associated with oxygen, determined at the previous step), we find the minimum. Check with the reference. If less, then go ahead. If more, then first check the reverse option - the distance between the hydrogen atoms of the first molecule and the oxygen of the second molecule. If less, then go ahead, more - go to the next molecules.
- We write down that these molecules are connected (if necessary, and the length of the bonds, too), proceed to the following. In this case, all connections with the translated molecules are written on the molecules that are in the original cell.
Algorithm output:
- We put a binary label for each molecule in the original cell (that is, without being translated) in True. A loop iterated over molecules in the original cell.
- We take the first molecule with the label True, put it the label False. We write it into an array of agglomerates, then we write down there all the molecules that have the label True and are associated with it, assigning False to them. Continue until
blueuntil new connections. - Repeat the previous paragraph, until all molecules will not stand False mark.
Then write out the arrays of agglomerates in any convenient form. At the end we add a block with general statistics (averaged over all points of the trajectory). You can additionally add statistics of bonds between, say, oxygen atoms.
And what else to add?
The first is cross-analysis for the presence or absence of cycles in the associate. Without going into the evidence, I note that. if a molecule associated with one molecule is assigned a weight of 0, with two -1, etc., and then calculate the total weight of the graph (associate), then you can determine the number of cycles in the graph:
- If the weight P of the graph is N-2, where N is the number of vertices of the graph (molecules in the agglomerate), then the graph has no cycles and has either a branched or linear structure
- If the weight of the P graph is greater than N-2, then the graph has cycles in the amount of (PN) / 2 + 1
The second is much more fun. There are original articles - here and here . The point is that if we have two graphs, then we can compare whether they are isomorphic (in the sense of the same ± permutations) and determine the permutation from which one graph is obtained from the other. True, if my memory serves me, in these articles there were typos in the algorithms themselves, be careful.
With reference to our system, we can create a database of main graphs and check the resulting associates for compliance with a specific graph. Also, you can hold and statistics.
Unfortunately, I did not implement this block. There is only a program that checks two isomorphism graphs.
Well, the third. Analysis of a single molecule is the dynamics of its location in various agglomerates throughout the entire trajectory.
In addition
Source codes of programs can be taken by reference . Everything is implemented on C. Unfortunately, there are no comments in the code.
The STAT_GEN program works with the format of files similar to TINKER's trajectory files with one exception - there is no block corresponding to the connection of different atoms with each other, and a column indicating the number of the molecule is added.
The AGL program pulls out separate agglomerates from trajectory files and writes them into the PDB format.
The graph program analyzes the isomorphism of graphs.
Unfortunately, the performance of these programs on Windows after the transfer to LInux (originally written under Windows, because there is, for example, the library conio.h) was not checked, so I don’t know what it is and how.
At the exit, you can get something like this image (from one of my presentations):
Or another structure, in the form of a graph:
Thanks for attention!
Source: https://habr.com/ru/post/160079/
All Articles