XHTML / CSS modeling of graphing diagrams
When you need to present data on your page in the form of a bar chart, it is often more convenient to generate the result graphically. The listing example shows a function that creates a bar chart of data using only CSS and XHTML.
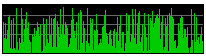
We want to write a script that will receive an array of values and put them on the drawing as lines with a thickness of 1 pixel for each value. In this case, to get the desired effect, we will use the expression div, for absolute positioning, and the height will be set using CSS. The resulting diagram can be placed on the page as required for the design implementation, setting the maximum height value, which will determine the relative change of each individual value.
1st chart:

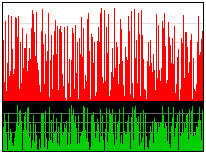
2nd chart:
')
Both:
We want to write a script that will receive an array of values and put them on the drawing as lines with a thickness of 1 pixel for each value. In this case, to get the desired effect, we will use the expression div, for absolute positioning, and the height will be set using CSS. The resulting diagram can be placed on the page as required for the design implementation, setting the maximum height value, which will determine the relative change of each individual value.
<?php // , . // , . //, , , 4 , , , , // . function create_chart($data, $height, $bars='red', $bg='white', $border='black', $grid='#ddd') { // , // , , // : static $idx = 0; $idx++; // 2 , : $height -= 2; // , //, . $scale = $height / (max($data) * 1.05); // $width = count($data); // CSS, //: echo" <style> #chartout{$idx}{ position: relative; height: ",$height + 2,"px; width: ",$width + 2,"px; background-color: {$border}; } #chartin{$idx}{ position: absolute; top: 1px; left: 1px; height: {$height}px; width: {$width}px; background-color: {$bg}; } .bar{$idx}{ position: absolute; bottom: 0; background-color: {$bars}; width: 1px; overflow: hidden; } .grid{$idx}{ position: absolute; left: 0; height: 1px; width: {$width}px; background-color: {$grid}; padding: 0; margin: 0; overflow: hidden; } </style> "; // : echo"<div id='chartout{$idx}'><div id='chartin{$idx}'>"; // , : foreach(range(1,3) as $line) { $lh = round($line * ($height/5)); echo "<div class='grid{$idx}' style='top: {$lh}px'></div>\n"; } // , // : foreach($data as $pos => $val) { $barheight = round($val * $scale); echo "<div class='bar{$idx}' style='left: {$pos}px; height: {$barheight}px;'></div>\n"; } // echo "\n</div></div>\n"; } // 200 . $chardata = array(); $chardata2 = array(); for ($i=0; $i<200; $i++) { $chardata[$i] = rand(1,1000); $chardata2[$i] = rand(1,1000); } // , 100 : create_char($chardata,100); // 50 , : create_char($chardata2,50,"#0c0","black","black","#666"); ?> 1st chart:
2nd chart:
')
Both:
Source: https://habr.com/ru/post/160065/
All Articles