Collection and analysis of statistics in free-to-play games
If you are developing free-to-play games, then you are probably interested in issues related to the collection and analysis of statistics. Why? Because statistics is an important component of the success of free-to-play games.
The purpose of my series of articles is to structure disparate information on this issue, skip it through the lens of our experience, and make recommendations on how
The success of free-to-play games depends on how much the players are involved in the game and are ready to buy in-game bonuses that take the game to a new level with extra features and achievements. The longer a player is in the game, the more he thinks about playing offline, the more likely he is to invest real money in his progress in the game. Of course, it is more difficult for developers to provide such a level of fascination in games than in the traditional pay-to-play model.
One of the secrets of the success of F2P games is that their design should be based not only on the creative component and "ingenious" ideas, but to a greater extent on the analysis of the players' behavior in the game, that is, on real data / statistics. At the same time, it is possible (and necessary) to start an F2P game with only a part of the finished content, and to control the development of the game / modify the content based on the needs of the players and the popularity of certain features. This approach is called a data-driven design, or "data-based design." It represents a cycle, at each iteration of which four stages are shown, as shown in the figure.
')

The permissible percentage of readiness of the content at the time of launch of the game depends on the genre, concept, etc. But what exactly should be ready when launching any free-to-play game is a powerful and flexible system for collecting and analyzing statistics, as well as a system for testing various functional / art / balance options. At the same time, all the indicators that are planned to be analyzed should be clearly planned, and the data analysis and visualization tools should be pre-selected, integrated and configured.
My series of articles will consist of three parts, which will address the following questions.
From my own experience I will say that at first, when working with statistics, I want to record almost everything in the game: every click, every game result and the display of each screen in the game. The thesis may be the following: the main thing is to collect everything and not to miss anything, but you can figure it out later. This approach does not work for several reasons.
You can greatly save on the analysis, if you collect only the statistics that is really important for making decisions on the future development of the game. To do this, start planning the collection of statistics at the stage of developing the concept of the game. For example, for our games, we make a table in which opposite to each indicator it is written, what hypothesis it tests and what improvement can be made on the basis of knowledge about it.
Statistics that are collected in games are conditionally divided into three parts:
The collection of statistics of the first type - business indicators - is best automated, so they are 90% identical for all F2P games. There is an impressive array of analytical services that provide convenient solutions with visual data visualization and simple integration. These services are mostly paid, but they can hardly be managed without them, since the invention of “bicycles” (self-realization of collecting business indicators) carries risks, unnecessary costs and waste of time. Read more about analytical systems in the third part of the series of articles.
Perhaps the most difficult part is tracking the players' behavior, since this part is usually unique for each game and requires certain analysis tools (which will be discussed in the second part of the article series). There are no ready-made solutions that can be integrated into the game and immediately start getting the necessary statistics. There are companies that can outsource the collection and analysis of statistics (for example, GamesAnalytics Ltd). But we prefer to allocate resources for this in the development team itself.
Technical information is statistics that are needed in order to make the game more stable and in time to correct the technical problems of the players.
This is an indicator of the "fascination" of the game, which tells how many people play the game every day.
The value of DAU / MAU characterizes the proportion of all players who play the game every day. The higher this value is, the more players are involved, the greater the chance that players will buy in-game content. It is believed that if DAU / MAU is greater than 0.2, the game can be considered successful.
It is worth noting that this is a rough estimate, as for accurate calculation of the return of players, it is necessary to clearly separate new players from returning at specified intervals (usually daily), take into account the source of traffic and the promotions. In a detailed study of these issues helps cohort analysis, which will be discussed in the second part of the cycle. This indicator of "fascination" is simple and gives a quick description of the game.
It is important to track% of "paying" players, as well as their demographic and other characteristics. Knowing their portrait, you can focus on this audience when developing a new functionality in games.
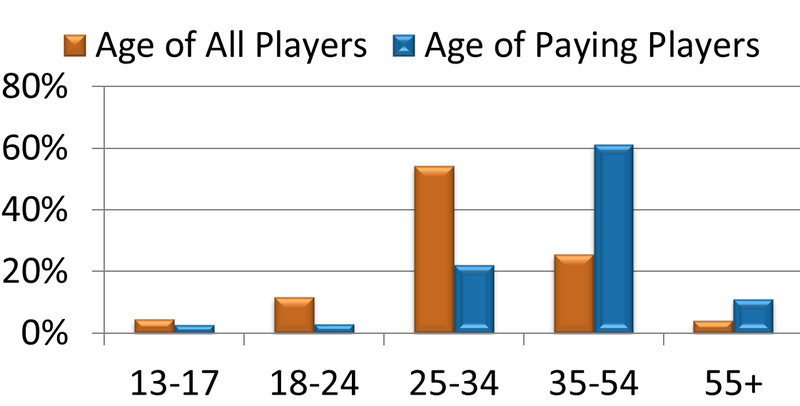
I will give an example on one of our games. The figure below shows the percentage of people playing by age and the percentage of people paying among them. It can be seen that it is better to focus on middle-aged people (35 - 54), since they tend to pay.
In addition, it is important to be able to allocate "whales" among the players: these are the people who spend a lot of money. It is necessary to get to know these people closer, to study their characteristic patterns of behavior, where they fall off in order to satisfy their needs to the maximum.
Why "whales"? In general, they sometimes divide all paying players into “minnows”, “dolphins” and “whales”. "Pescari" spend little - about $ 1 per month. "Dolphins" - about $ 5, and "whales" - a lot. According to Gigaom in Zynga games, the top 20% of “paying” players spend an average of $ 1,100 per year ($ 90 per month).
Income indicators:
Virality is a way to spread information about the game on the Internet and social networks from player to player. If the game is well developed mechanisms of virality, the cost of attracting new users is reduced. To monitor virality, you can use the k-factor.
The k-factor can be calculated using the following formula: k = X * Y, where X is the number of invitations per player, Y is the percentage of people who accepted these invitations when they joined the game. If the k-factor is 0.2, then for each new player you can get 0.2 players who came into the game by invitation (in other words: for every five new players, we get one free player who came into the game by invitation). It is clear that the higher the k-factor of the game, the cheaper it becomes to attract new players to the game.
The first thing you need to analyze the behavior of players is the statistics on the progress of players in the game. To track the progress of the game scenario, the control points that players must pass are determined. Analysis of the rate of advancement at these points, the parameters of the players at these points will help identify obstacles or difficulties in the game that need to be eliminated.
If the player has made the first purchase, then he is transferred to the category of "paying" players. It is believed that the first purchase is a psychological barrier, once having overcome that, players part with the money much easier. Plan in advance in the game sequence of actions that may lead the player to the first purchase. Keep track of how many players implement the scenarios you define, work on conversion, improving the interface and balance.
If a player left the game during a tutorial, consider that this player is lost to you: with a high probability he will never return to the game. To avoid this, the beginning of the game should be directed as much as possible. It is necessary to track each step of the tutorial in order to understand on which screen the player got bored and left the game, that it was not clear to him whether he could learn, did the first task on his own.
It may be useful to track the player's first and last actions during a game session.
The first event sets the tone for the entire game session. It can entice the player and make them spend a lot of time in the game. But the first event may “scare” the player, as a result, he will close the game and may not return. It is necessary to compare and test - what events / windows / greetings lead to more time in the game.
The last event is also important. The last event usually becomes exactly the obstacle in the game that should be removed. If the last event during a gaming session is scheduled (for example, the player is waiting for the completion of some game cycle), it is worth making this event so that the player would like to enter the game next time.
As I am developing mobile games, I’ll give an example from, say, the fascinating Android world.
It is useful to collect statistics on the technical equipment of player devices to ensure the stability of the game. For example, it is important to know which devices, firmware, screen resolutions, types of hardware-supported textures are most popular among players. It is also important to know which hardware configuration brings the most revenue and recurrence of players (the difference in earnings can differ by tens of percent). It is necessary to reduce the list of supported devices, if they do not bring income and if the game is unstable. It besides will prevent the application from negative reviews in the store.
If the game uses resource resume, collect statistics about the successful resume, the number of requests for a resume, and errors that occur during the resume. If the resume takes place before the first start of the game, then it can scare away a substantial part of the audience. And if the players did not download the game, they certainly would not return and pay. Therefore, you need to take care of the maximum stability of the download procedure and find a lesson for players during the waiting time. And even better is to find the opportunity not to download the data at the start, but to download it inside the game for an extra fee.
If the game uses offing systems as an additional monetization, it makes sense to track the effectiveness of their work, including checking coverage with offers in different countries on different devices.
A lot of useful information can be found in the documentation, presentations, articles prepared by the analytical services themselves. As a rule, he cites competent examples, cases, rationales, indicators of the industry. Here is a list of services that helped me deal with the issue of collecting and analyzing statistics in games:
Another useful article about the development of free-to-play games:
The Design of Free-To-Play Games: Part 1
The Design of the Free-to-Play Games, Part 2
Of course, here are the most basic metrics that should be monitored when developing free-to-play games. But even they already give a lot of information for making decisions on the development of the game.
Do you have ideas for other important metrics? I would be glad to see your comment!
In the next article I would like to dwell in detail on the basic methods of analysis that must be owned in order to extract really useful information from a sea of data. The main methods to be considered are: segmentation of users, cohort analysis (behavior of groups of people over time), “funnels” or analysis of transition sequences, A / B testing.
The purpose of my series of articles is to structure disparate information on this issue, skip it through the lens of our experience, and make recommendations on how
- what indicators should be monitored in games;
- what analysis tools can help with statistics;
- what services of collecting and analyzing statistics exist with their strengths and weaknesses.
The success of free-to-play games depends on how much the players are involved in the game and are ready to buy in-game bonuses that take the game to a new level with extra features and achievements. The longer a player is in the game, the more he thinks about playing offline, the more likely he is to invest real money in his progress in the game. Of course, it is more difficult for developers to provide such a level of fascination in games than in the traditional pay-to-play model.
One of the secrets of the success of F2P games is that their design should be based not only on the creative component and "ingenious" ideas, but to a greater extent on the analysis of the players' behavior in the game, that is, on real data / statistics. At the same time, it is possible (and necessary) to start an F2P game with only a part of the finished content, and to control the development of the game / modify the content based on the needs of the players and the popularity of certain features. This approach is called a data-driven design, or "data-based design." It represents a cycle, at each iteration of which four stages are shown, as shown in the figure.
')
The permissible percentage of readiness of the content at the time of launch of the game depends on the genre, concept, etc. But what exactly should be ready when launching any free-to-play game is a powerful and flexible system for collecting and analyzing statistics, as well as a system for testing various functional / art / balance options. At the same time, all the indicators that are planned to be analyzed should be clearly planned, and the data analysis and visualization tools should be pre-selected, integrated and configured.
My series of articles will consist of three parts, which will address the following questions.
- The main indicators that should be monitored in free-to-play games, and data on the behavior of players that should be analyzed to improve these indicators.
- The main methods of analyzing the collected data for making decisions on the development of the game: user segmentation, cohort analysis, “funnels” or analysis of transition sequences, A / B testing.
- Existing services with their strengths and weaknesses.
What statistics need to be collected in F2P games
From my own experience I will say that at first, when working with statistics, I want to record almost everything in the game: every click, every game result and the display of each screen in the game. The thesis may be the following: the main thing is to collect everything and not to miss anything, but you can figure it out later. This approach does not work for several reasons.
- Analyzing huge amounts of data is expensive: you need to attract many highly skilled analysts who need to have advanced knowledge, both in statistics and in its processing methods, to be familiar with OLAP-cubes, artificial intelligence algorithms, etc. That is, the less data - the better!
- The data quickly become obsolete, as they depend on the marketing campaigns carried out, on the source of attracting players, on the innovations in the game, and even on the season. Therefore, it is important to watch all indicators in realtime mode.
You can greatly save on the analysis, if you collect only the statistics that is really important for making decisions on the future development of the game. To do this, start planning the collection of statistics at the stage of developing the concept of the game. For example, for our games, we make a table in which opposite to each indicator it is written, what hypothesis it tests and what improvement can be made on the basis of knowledge about it.
| Indicator | Decisions made |
| Revenue by Levels and Domestic Products | If advanced players pay more, then you need to work to encourage buying earlier (analyze needs at early levels, reduce prices for some products, etc.). If you pay more at the beginning of the game, then you need to introduce special products for more advanced players, add an additional opportunity to spend the accumulated currency. |
| Points earned by players by level | The data will help to set more adequate goals for the players, as well as adjust the game balance. |
| Game assignment time | For each task there is an approximate estimate of how long it will take a player to complete it. By comparing the actual time of the task with the expected, you can adjust the parameters of tasks and their sequence. |
Statistics that are collected in games are conditionally divided into three parts:
- business performance;
- player behavior;
- Technical information.
The collection of statistics of the first type - business indicators - is best automated, so they are 90% identical for all F2P games. There is an impressive array of analytical services that provide convenient solutions with visual data visualization and simple integration. These services are mostly paid, but they can hardly be managed without them, since the invention of “bicycles” (self-realization of collecting business indicators) carries risks, unnecessary costs and waste of time. Read more about analytical systems in the third part of the series of articles.
Perhaps the most difficult part is tracking the players' behavior, since this part is usually unique for each game and requires certain analysis tools (which will be discussed in the second part of the article series). There are no ready-made solutions that can be integrated into the game and immediately start getting the necessary statistics. There are companies that can outsource the collection and analysis of statistics (for example, GamesAnalytics Ltd). But we prefer to allocate resources for this in the development team itself.
Technical information is statistics that are needed in order to make the game more stable and in time to correct the technical problems of the players.
Business indicators
DAU / MAU
This is an indicator of the "fascination" of the game, which tells how many people play the game every day.
- DAU (daily active users) is the number of unique users who launched the game at least once a day.
- MAU (monthly active users) is the number of unique users who launched the game at least once a month.
The value of DAU / MAU characterizes the proportion of all players who play the game every day. The higher this value is, the more players are involved, the greater the chance that players will buy in-game content. It is believed that if DAU / MAU is greater than 0.2, the game can be considered successful.
It is worth noting that this is a rough estimate, as for accurate calculation of the return of players, it is necessary to clearly separate new players from returning at specified intervals (usually daily), take into account the source of traffic and the promotions. In a detailed study of these issues helps cohort analysis, which will be discussed in the second part of the cycle. This indicator of "fascination" is simple and gives a quick description of the game.
"Paying" players
It is important to track% of "paying" players, as well as their demographic and other characteristics. Knowing their portrait, you can focus on this audience when developing a new functionality in games.
I will give an example on one of our games. The figure below shows the percentage of people playing by age and the percentage of people paying among them. It can be seen that it is better to focus on middle-aged people (35 - 54), since they tend to pay.
In addition, it is important to be able to allocate "whales" among the players: these are the people who spend a lot of money. It is necessary to get to know these people closer, to study their characteristic patterns of behavior, where they fall off in order to satisfy their needs to the maximum.
Why "whales"? In general, they sometimes divide all paying players into “minnows”, “dolphins” and “whales”. "Pescari" spend little - about $ 1 per month. "Dolphins" - about $ 5, and "whales" - a lot. According to Gigaom in Zynga games, the top 20% of “paying” players spend an average of $ 1,100 per year ($ 90 per month).
Income indicators:
- ARPU - the average income per player (both paid and free installations are considered; the indicator is usually calculated per month).
- ARPPU - how much paying players spend on average (that is, the cost of the game after the fact).
k-factor - the coefficient of virality
Virality is a way to spread information about the game on the Internet and social networks from player to player. If the game is well developed mechanisms of virality, the cost of attracting new users is reduced. To monitor virality, you can use the k-factor.
The k-factor can be calculated using the following formula: k = X * Y, where X is the number of invitations per player, Y is the percentage of people who accepted these invitations when they joined the game. If the k-factor is 0.2, then for each new player you can get 0.2 players who came into the game by invitation (in other words: for every five new players, we get one free player who came into the game by invitation). It is clear that the higher the k-factor of the game, the cheaper it becomes to attract new players to the game.
Analysis of the behavior of players
Player progress in the game
The first thing you need to analyze the behavior of players is the statistics on the progress of players in the game. To track the progress of the game scenario, the control points that players must pass are determined. Analysis of the rate of advancement at these points, the parameters of the players at these points will help identify obstacles or difficulties in the game that need to be eliminated.
Scenarios of the first purchase
If the player has made the first purchase, then he is transferred to the category of "paying" players. It is believed that the first purchase is a psychological barrier, once having overcome that, players part with the money much easier. Plan in advance in the game sequence of actions that may lead the player to the first purchase. Keep track of how many players implement the scenarios you define, work on conversion, improving the interface and balance.
Tutorial
If a player left the game during a tutorial, consider that this player is lost to you: with a high probability he will never return to the game. To avoid this, the beginning of the game should be directed as much as possible. It is necessary to track each step of the tutorial in order to understand on which screen the player got bored and left the game, that it was not clear to him whether he could learn, did the first task on his own.
First and last player action
It may be useful to track the player's first and last actions during a game session.
The first event sets the tone for the entire game session. It can entice the player and make them spend a lot of time in the game. But the first event may “scare” the player, as a result, he will close the game and may not return. It is necessary to compare and test - what events / windows / greetings lead to more time in the game.
The last event is also important. The last event usually becomes exactly the obstacle in the game that should be removed. If the last event during a gaming session is scheduled (for example, the player is waiting for the completion of some game cycle), it is worth making this event so that the player would like to enter the game next time.
Technical Statistics Collection
As I am developing mobile games, I’ll give an example from, say, the fascinating Android world.
It is useful to collect statistics on the technical equipment of player devices to ensure the stability of the game. For example, it is important to know which devices, firmware, screen resolutions, types of hardware-supported textures are most popular among players. It is also important to know which hardware configuration brings the most revenue and recurrence of players (the difference in earnings can differ by tens of percent). It is necessary to reduce the list of supported devices, if they do not bring income and if the game is unstable. It besides will prevent the application from negative reviews in the store.
If the game uses resource resume, collect statistics about the successful resume, the number of requests for a resume, and errors that occur during the resume. If the resume takes place before the first start of the game, then it can scare away a substantial part of the audience. And if the players did not download the game, they certainly would not return and pay. Therefore, you need to take care of the maximum stability of the download procedure and find a lesson for players during the waiting time. And even better is to find the opportunity not to download the data at the start, but to download it inside the game for an extra fee.
If the game uses offing systems as an additional monetization, it makes sense to track the effectiveness of their work, including checking coverage with offers in different countries on different devices.
What to read on this topic
A lot of useful information can be found in the documentation, presentations, articles prepared by the analytical services themselves. As a rule, he cites competent examples, cases, rationales, indicators of the industry. Here is a list of services that helped me deal with the issue of collecting and analyzing statistics in games:
Another useful article about the development of free-to-play games:
The Design of Free-To-Play Games: Part 1
The Design of the Free-to-Play Games, Part 2
To be continued…
Of course, here are the most basic metrics that should be monitored when developing free-to-play games. But even they already give a lot of information for making decisions on the development of the game.
Do you have ideas for other important metrics? I would be glad to see your comment!
In the next article I would like to dwell in detail on the basic methods of analysis that must be owned in order to extract really useful information from a sea of data. The main methods to be considered are: segmentation of users, cohort analysis (behavior of groups of people over time), “funnels” or analysis of transition sequences, A / B testing.
Source: https://habr.com/ru/post/159517/
All Articles