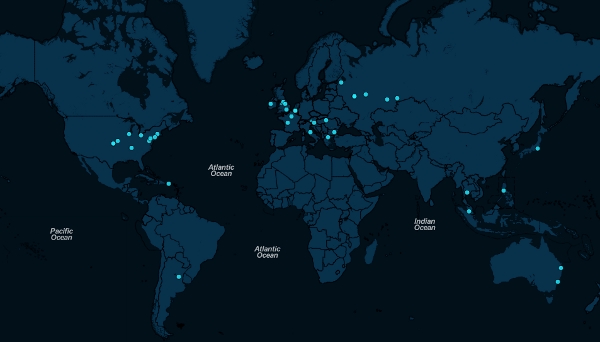
We visualize geoinformation from logs on a web map in real time.
In order to avoid ambiguities, I will outline the essence. When applying for a new job, I was given a test task, which can be briefly described as: “Write an analogue of Glow for geovizualizing the events of users entering the online store.” Simply put, it is necessary to monitor the system log for the occurrence of certain events and, in the case of these, perform (in this case) a point on the map, which will be determined by the user's IP address. The goal of implementation: to create a pleasant-looking “toy” for presentational purposes, capable of immersing the beholder into nirvana of harmony and aesthetic pleasure. The main condition was the use of Java technologies in the development of the stack, which caused many decisions to be made. In addition, it was decided to implement this in the form of a one-page site. And since I was extremely familiar with Java and the web (I wrote mostly in C / C ++), I had to learn a lot. Well, we will understand together.
The article is intended for interested and beginners, however, it does not “chew on” simple things that can be read with the help of documentation or specialized articles. The most useful resources, a link to the sources (distributed under the BSD license ) and a link to the working version are given at the end of the article.
And in general, why not use the source code of the above Glow? First, they are quite specific for the amount of data Mozilla was using — remember the number of Firefox installations on the launch day, and also the fact that their logging system is decentralized. In our case, about 100 records per second are written to a single log file at the peak, of which only a part needs to be visualized. Secondly, the map in Glow is not the most pleasant in appearance. And thirdly, this is a test task :)
Quick look
What is required from our mini-system?
- Keep track of updates in the log file (such as
tail -f). In addition, it should be noted that once a day the log file is closed and carefully archived, and a new file takes its place, that is, you need to monitor these actions and switch to the current log. - Determine the type of event corresponding to each new record in the log, and if it is necessary to display it on the map as a point, allow (rezolvit) the coordinates of the point by the IP address contained in the record.
- Event data must be transmitted in real time to clients (in this case, to the script in the client’s browser).
- The client script should deal with the output of information in the form of a neat card with points on it, which are colored according to the type of the corresponding event.
After conducting a small study on each item, it was decided the following. Watching the log, parsing the entries, resolving the IP will be a small java daemon (it sounds funny, I understand, but nothing), which will send the data to the server via HTTP POST. This will then make it easy to change parts of the system without a headache. The server will also be a part-time servlet container, for which we will write the corresponding servlet. As a client side, there should be some kind of cartographic widget (render map) that will communicate with the server asynchronously. There are several main ways (more details in article [1] and review [2] ):
- Comet. The client connects to the server, and the server does not terminate the connection, but keeps it open, which allows you to immediately send it to the client when it arrives (push). As an option - the use of technology WebSocket .
- Frequent polls. The client with the specified frequency polls the server for new data.
- "Long" polls (long polling). Something in between the previous two ways. The client requests new data from the server, and if there is no such data on the server yet, the server does not close the connection. When data is received, it is sent to the client, and the latter in turn again sends a request for new data.
The choice fell on long polling, because WebSocket is not supported by all browsers , and frequent polls simply eats away traffic for nothing, exploiting server resources. In addition, the web server (partly servlet-container) Jetty allows you to use the continuations technique to process long polling requests (see [1] ). But let me tell you, where is realtime here? We are not writing an embedded system for airplanes, but a neat presentation map, so the delays between the user's action and the point on the observer map in 1-2 seconds are not so critical, is it?
Among the mapping engines, Leaflet was chosen as one of the most pleasant-looking and having a simple, friendly API. Also, pay attention to good Leaflet browsers support.
Well, let's proceed to implementation, and we will solve the problems at the place of receipt.
Get data from the log
How to keep track of updates to the log, given its periodic archiving-creation? You can use, for example, the
Tailer class from the well-known Apache Commons library, but we will go our own, partly in a similar way. Our TailReader class TailReader initialized by the directory in which the log is located, with a regular schedule that describes the name of the log file (since it can change) and the update period — the time through which we will periodically check for new entries in the log. The class interface resembles working with standard I / O streams (streams), however, it blocks the execution process when calling nextRecord() , if no new entries appear in the log. To check for new entries (without blocking), you can use the hasNext() method. Since the log is monitored in a separate thread (not to be confused with I / O, thread), there are start() and stop() methods for controlling the operation of the thread. If the file stream is closed (the log has been sent for archiving), after a set number of attempts to read, the class object will decide that it is time to open a new log. The log is searched for according to the rules specified in getLogFile() : /** * - * @return - null */ private File getLogFile() { File logCatalog = new File(logFileCatalog); File[] files = logCatalog.listFiles(new FileFilter() { @Override public boolean accept(File pathname) { return pathname.canRead() && pathname.isFile() && pathname.getName().matches(logFileNamePattern); } }); if (0 == files.length) return null; if (files.length > 1) Arrays.sort(files, new Comparator<File>() { @Override public int compare(File o1, File o2) { return (int) (o1.lastModified() - o2.lastModified()); } }); return files[files.length - 1]; } After we have learned to follow the updates of the log, it is necessary to do something with these updates. First of all, it is necessary to determine the type of this event, and if it is necessary to display it on the map, pull out the client's IP and rezolvit it to geo-coordinates.
The
RecordParser class, as it is not difficult to guess, analyzes the lines of the log file using regular expressions. The LogEvent parse(String record) method returns a simple object that encapsulates the event type and IP address, or null if we are not interested in the given log record (this, by the way, is not the best practice in the world of Java development - it's better to use the Null pattern Object ). In this case, the records are also filtered from the requests of search robots (they are not exactly users of the store, right?).Finally, the
IpToLocationConverter class IpToLocationConverter with resolving IP addresses to their respective geo-coordinates using the Maxmind ( Java API to it ) and IpGeoBase services (accessed through the XML API , which is encapsulated in the com.ecwid.geowid.daemon.resolvers package ). Maxmind rather lousy rezolvit Russian addresses, so we use an additional IpGeoBase. The Maxmind API is trivial, the resolving is done through a database file located locally. For IpGeoBase, a resolver was written that caches calls to the service for obvious reasons.In order not to load the server, we will send it data in batches of several pieces so that the records in one pack differ slightly in time. For this, objects of the points accumulated for visualization on the map (class
Point ) are stored in a buffer - an object of the PointsBuffer class and “reset” when it is filled into the server in JSON format (serializing objects using Gson ).The entire logic of the daemon is in the
GeowidDaemon class. The daemon settings are stored in XML (vulgarity on my part, it would be possible to manage properies or YAML files, but I wanted to try XML to Object mapping ). pay attention to <events> <event> <type>def</type> <pattern>\b((?:\d{1,3}\.){3}\d{1,3})\b\s+script\.js</pattern> </event> <event> <type>mob</type> <pattern>\b((?:\d{1,3}\.){3}\d{1,3})\b\s+mobile:</pattern> </event> <event> <type>api</type> <pattern>\b((?:\d{1,3}\.){3}\d{1,3})\b\s+api:</pattern> </event> </events> Types of events:
def - the opening of the "ordinary" casterer; mob - the opening of the mobile casterer; api - the service API call. The type is determined by the location in the log of the substring corresponding to a particular regular program in which the IP is allocated to the group.To launch the daemon in the vastness of the network, a wonderful script was found.
')
Distribute data to customers
Let's rock, what's up with the vaunted continuations in API Jetty (let's agree to use the 7th version of the server)? This is perfectly written in the documentation [3] , including code examples. And we will use them. Our servlet
GeowidServlet minimalist: it can receive data from a daemon and give it to clients. The most interesting in this respect is the following code: @Override protected void doPost(HttpServletRequest req, HttpServletResponse resp) throws ServletException, IOException { synchronized (continuations) { for (Continuation continuation : continuations.values()) { continuation.setAttribute(resultAttribute, req.getParameter(requestKey)); try { continuation.resume(); } catch (IllegalStateException e) { // ok } } continuations.clear(); resp.setStatus(HttpServletResponse.SC_OK); } } @Override protected void doGet(HttpServletRequest req, HttpServletResponse resp) throws ServletException, IOException { String reqId = req.getParameter(idParameterName); if (null == reqId) { resp.sendError(HttpServletResponse.SC_BAD_REQUEST, "Request ID needed"); logger.info("Request without ID rejected [{}]", req.getRequestURI()); return; } Object result = req.getAttribute(resultAttribute); if (null == result) { Continuation continuation = ContinuationSupport.getContinuation(req); synchronized (continuations) { if (!continuations.containsKey(reqId)) { continuation.setTimeout(timeOut); try { continuation.suspend(); continuations.put(reqId, continuation); } catch (IllegalStateException e) { logger.warn("Continuation with reqID={} can't be suspended", reqId); resp.sendError(HttpServletResponse.SC_INTERNAL_SERVER_ERROR); } } else if (continuation.isExpired()) { synchronized (continuations) { continuations.remove(reqId); } resp.setContentType(contentType); resp.getWriter().println(emptyResult); } else { resp.sendError(HttpServletResponse.SC_BAD_REQUEST, "Request ID conflict"); } } } else { resp.setContentType(contentType); resp.getWriter().println((String) result); } } What's going on here?
When a client comes for new data, we check the availability of its unique identifier in the GET-request parameters (which, in truth, is pseudo-unique, see the implementation of the client-side,
getPseudoGUID() function here ), if the ID is not present - we “sew” the client. This is necessary in order to correctly identify the continuation associated with a particular client. Next, we check whether the attribute containing the necessary data is set for this request. Naturally, if the client came to us for the first time, there can be no talk about any data. Therefore, we create a continuation for it with a given timeout, suspend it and place it in a hash table for storage. However, there are situations where the continuation timeout has expired, and there is no data as it is, or not. In this case, checking the if (continuation.isExpired()) condition if (continuation.isExpired()) helps us; when it passes, the servlet gives the client an empty array in JSON, removing the corresponding continuation from the table as unnecessary.If the data attribute is set, we simply return this data to the client. Where does this data come from? In the POST request handler, of course. As soon as the daemon sent the data, the servlet goes over the table of “suspended” continuations, setting an attribute with the data for each one and resuming each (resume), then clearing the table. It is at this moment that the
doGet() method is re-entered for each continuation, but with the data the user needs.You can, for example, measure the mysterious power of these very continuations with the help of a profiler under load. For this, the author used VisualVM and Siege . From the author testers mediocre, so the test looked very artificial. JVM “warmed up” for about an hour, settling into a 15Mb heap space. After that, with the help of Siege, we load the server with parallel 3000 requests per second (I did not want to poke around in the system to raise the limits for open files, etc.) for 5 minutes. JVM otshila ~ 250Mb heap space, loading the processor core by ~ 10-15%. I think a good result for beginners.
Visualization sir
Immediately make a reservation: maybe my JavaScript code will seem “non-canonical” from the point of view of a professional frontend developer. To judge those who will understand in my code :)
So, use Leaflet. How do we display points on the map? Standard markers look inappropriate. Using png or, forbid W3C, gif, you can not get a nice picture with animation points. There are two ways:
- Animation by SVG. On Habré recently skipped a great article on this topic. Pros: Leaflet already has a great plugin (see the demo at the bottom of the page), using the excellent Raphaël library, and this library allows you to draw SVG even on IE6 (more precisely VML ). Disadvantages: due to the specifics of SVG, the animation on it is quite a resource-intensive operation (imagine yourself in the browser: you will have to parse the XML most of the time and render the graphics in accordance with the changes in it).
- HTML5's
. , , , ( www.html5canvastutorials.com KineticJS). : , . : .
Source: https://habr.com/ru/post/158333/
All Articles