The history of the struggle for IOPS in the self-assembly SAN
Hello!
One of my projects uses something a bit like a private cloud. These are several servers for storing data and several diskless ones responsible for virtualization. The other day I seem to have finally put an end to the question of squeezing the maximum performance of the disk subsystem of this solution. It was quite interesting, and even at some moments, quite unexpectedly. Therefore, I want to share my story with the habrasoobshchestvu, which began in the distant 2008th year, even before the appearance of the “First Cloud Provider of Russia” and the action on sending free water meters.
Virtual hard disks are exported via a separate gigabit network using AoE protocol . In short, this is the brainchild of Coraid, which offered to transfer ATA commands over the network directly. The protocol specification takes only ten pages! The main feature is the absence of TCP / IP. When transferring data, a minimal overhead projector is obtained, but as a payment for simplicity, it is impossible to route.
')
Why such a choice? If you omit the reprint of official sources - including and banal lowcost.
Accordingly, in the storages we used ordinary SATA drives with 7200 rpm. Their flaw is known to everyone - low IOPS.
The very first, popular and obvious way to solve the problem of random access speed. They took mdadm into their hands, drove a couple of corresponding commands into the console, raised LVM on top (we are going to distribute block devices for virtual machines as a result) and launched several naive tests.
To be honest, it was scary to check IOPS, there were no solutions to the problem other than switching to SCSI or writing your own crutches.
Although the network was also gigabit, from diskless servers, the read speed did not reach the expected ~ 100MiB / sec. Naturally, the drivers for the network cards were to blame (hello, Debian). Using fresh drivers from the manufacturer’s site seems to have partially eliminated the problem ...
In all AoE speed optimization manuals, the first item indicates the maximum MTU setting. At that moment it was 4200. Now it seems ridiculous, but compared to the standard 1500, the linear read speed really reached ~ 120MiB / sec, cool! And even with a slight load on the disk subsystem by all virtual servers, local caches rectified the situation and within each virtual machine the linear read speed was kept at least 50MiB / sec. In fact, pretty good! Over time, we changed the network cards, the switch - and raised the MTU to the maximum 9K.
Yes, one of the 24/7 projects was jerking MySQL, both for writing and reading. It looked something like this:
Harmless? As if not so. A huge stream of small requests, 70% io wait on a virtual server, 20% load on each of the hard drives (if you believe atop) on the storage, and such a dull picture on the other virtual machines:
And it is still fast! Often, the linear reading speed was no more than 1-2 MiB / sec.
I think everyone already guessed what we ran into. Low IOPS SATA drives, even though RAID10.
How did these guys appear on time! This salvation, this is the same! Life is getting better, we will be saved!
Urgent purchase of Intel's SSD, including the module and flashcache utilities in the live image of the storage servers, setting the write-back cache and fire in the eyes. Yeah, all the zeros counters. Well, the LVM + Flashcache features are easy to googling, the problem is quickly resolved.
On a virtual server with MySQL, loadavg dropped from 20 to 10. Linear reading on the rest of the virtual servers increased to stable 15-20 MiB / sec. Do not be fooled!
After some time, I collected the following statistics:
read hit percent: 13, write hit percent: 3. A huge amount of uncached reads / writes. It turns out that flashcache worked, but not at all. There were a couple of dozen virtual machines, the total amount of virtual disks did not exceed a terabyte, disk activity was small. Those. such a low percentage of hitting the cache is not due to the activity of neighbors.
Looking at this for the hundredth time:
I decided to open my favoriteExcel LibreOffice Calc:

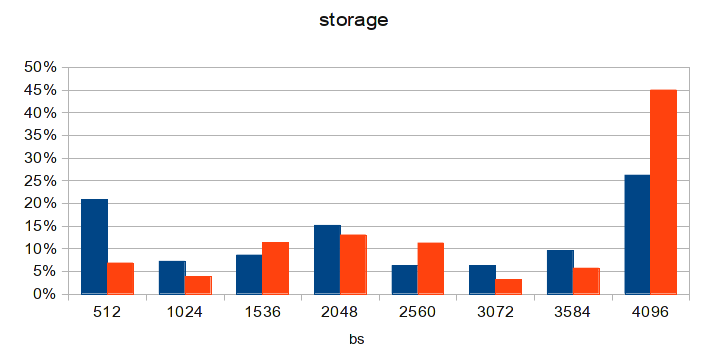
The diagram is plotted according to the last line, the histogram of the distribution of requests by block sizes.
We all know that
Hard drives usually operate in blocks of 512 bytes. Exactly like AoE. The Linux kernel is 4096 bytes each. Data block size in flascache is also 4096.
Summing up the number of requests with block sizes different from 4096, then it can be seen that the received number suspiciously coincides with the number uncached reads + uncached writes from the flashcache statistics. Only 4K blocks are cached! Remember that MTU was originally 4200? If we subtract the size of the AoE packet header from this, we get the size of the data block at 3584. This means that any request to the disk subsystem will be split into at least 2 AoE packets: 3584 bytes and 512 bytes. What exactly was clearly visible on the original diagram, which I saw. Even on the diagram from the article, the predominance of 512 byte packets is noticeable. And the MTU in 9K recommended at every corner also has a similar problem: the size of the data block is 8704 bytes, these are 2 blocks of 4K and one of 512 bytes (which is exactly what is observed in the diagram from the article). Opanki! The decision, I think, is obvious to everyone.
The diagram was made several days after updating the configuration on one of the diskless nodes. After updating the MTU on the rest - the situation will become even better. And loadavg on a virtual server with MySQL dropped to 3!
Not being system administrators with 20 years of experience, we solved problems using the “standard” and most popular approaches known to the community at the appropriate time. But in the real world there is always a place for imperfections, crutches and assumptions. To which we, in fact, ran into.
Here is such a story.
One of my projects uses something a bit like a private cloud. These are several servers for storing data and several diskless ones responsible for virtualization. The other day I seem to have finally put an end to the question of squeezing the maximum performance of the disk subsystem of this solution. It was quite interesting, and even at some moments, quite unexpectedly. Therefore, I want to share my story with the habrasoobshchestvu, which began in the distant 2008th year, even before the appearance of the “First Cloud Provider of Russia” and the action on sending free water meters.
Architecture
Virtual hard disks are exported via a separate gigabit network using AoE protocol . In short, this is the brainchild of Coraid, which offered to transfer ATA commands over the network directly. The protocol specification takes only ten pages! The main feature is the absence of TCP / IP. When transferring data, a minimal overhead projector is obtained, but as a payment for simplicity, it is impossible to route.
')
Why such a choice? If you omit the reprint of official sources - including and banal lowcost.
Accordingly, in the storages we used ordinary SATA drives with 7200 rpm. Their flaw is known to everyone - low IOPS.
RAID10
The very first, popular and obvious way to solve the problem of random access speed. They took mdadm into their hands, drove a couple of corresponding commands into the console, raised LVM on top (we are going to distribute block devices for virtual machines as a result) and launched several naive tests.
root@storage:~# hdparm -tT /dev/md127 /dev/md127: Timing cached reads: 9636 MB in 2.00 seconds = 4820.51 MB/sec Timing buffered disk reads: 1544 MB in 3.03 seconds = 509.52 MB/sec To be honest, it was scary to check IOPS, there were no solutions to the problem other than switching to SCSI or writing your own crutches.
Network and MTU
Although the network was also gigabit, from diskless servers, the read speed did not reach the expected ~ 100MiB / sec. Naturally, the drivers for the network cards were to blame (hello, Debian). Using fresh drivers from the manufacturer’s site seems to have partially eliminated the problem ...
In all AoE speed optimization manuals, the first item indicates the maximum MTU setting. At that moment it was 4200. Now it seems ridiculous, but compared to the standard 1500, the linear read speed really reached ~ 120MiB / sec, cool! And even with a slight load on the disk subsystem by all virtual servers, local caches rectified the situation and within each virtual machine the linear read speed was kept at least 50MiB / sec. In fact, pretty good! Over time, we changed the network cards, the switch - and raised the MTU to the maximum 9K.
MySQL has not come yet
Yes, one of the 24/7 projects was jerking MySQL, both for writing and reading. It looked something like this:
Total DISK READ: 506.61 K/s | Total DISK WRITE: 0.00 B/s TID PRIO USER DISK READ DISK WRITE SWAPIN IO> COMMAND 30312 be/4 mysql 247.41 K/s 11.78 K/s 0.00 % 11.10 % mysqld 30308 be/4 mysql 113.89 K/s 19.64 K/s 0.00 % 7.30 % mysqld 30306 be/4 mysql 23.56 K/s 23.56 K/s 0.00 % 5.36 % mysqld 30420 be/4 mysql 62.83 K/s 11.78 K/s 0.00 % 5.03 % mysqld 30322 be/4 mysql 23.56 K/s 23.56 K/s 0.00 % 2.58 % mysqld 30445 be/4 mysql 19.64 K/s 19.64 K/s 0.00 % 1.75 % mysqld 30183 be/4 mysql 7.85 K/s 7.85 K/s 0.00 % 1.15 % mysqld 30417 be/4 mysql 7.85 K/s 3.93 K/s 0.00 % 0.36 % mysqld Harmless? As if not so. A huge stream of small requests, 70% io wait on a virtual server, 20% load on each of the hard drives (if you believe atop) on the storage, and such a dull picture on the other virtual machines:
root@mail:~# hdparm -tT /dev/xvda /dev/xvda: Timing cached reads: 10436 MB in 1.99 seconds = 5239.07 MB/sec Timing buffered disk reads: 46 MB in 3.07 seconds = 14.99 MB/sec And it is still fast! Often, the linear reading speed was no more than 1-2 MiB / sec.
I think everyone already guessed what we ran into. Low IOPS SATA drives, even though RAID10.
Flashcache
How did these guys appear on time! This salvation, this is the same! Life is getting better, we will be saved!
Urgent purchase of Intel's SSD, including the module and flashcache utilities in the live image of the storage servers, setting the write-back cache and fire in the eyes. Yeah, all the zeros counters. Well, the LVM + Flashcache features are easy to googling, the problem is quickly resolved.
On a virtual server with MySQL, loadavg dropped from 20 to 10. Linear reading on the rest of the virtual servers increased to stable 15-20 MiB / sec. Do not be fooled!
After some time, I collected the following statistics:
root@storage:~# dmsetup status cachedev 0 2930294784 flashcache stats: reads(85485411), writes(379006540) read hits(12699803), read hit percent(14) write hits(11805678) write hit percent(3) dirty write hits(4984319) dirty write hit percent(1) replacement(144261), write replacement(111410) write invalidates(2928039), read invalidates(8099007) pending enqueues(2688311), pending inval(1374832) metadata dirties(11227058), metadata cleans(11238715) metadata batch(3317915) metadata ssd writes(19147858) cleanings(11238715) fallow cleanings(6258765) no room(27) front merge(1919923) back merge(1058070) disk reads(72786438), disk writes(374046436) ssd reads(23938518) ssd writes(42752696) uncached reads(65392976), uncached writes(362807723), uncached IO requeue(13388) uncached sequential reads(0), uncached sequential writes(0) pid_adds(0), pid_dels(0), pid_drops(0) pid_expiry(0) read hit percent: 13, write hit percent: 3. A huge amount of uncached reads / writes. It turns out that flashcache worked, but not at all. There were a couple of dozen virtual machines, the total amount of virtual disks did not exceed a terabyte, disk activity was small. Those. such a low percentage of hitting the cache is not due to the activity of neighbors.
Insight!
Looking at this for the hundredth time:
root@storage:~# dmsetup table cachedev 0 2930294784 flashcache conf: ssd dev (/dev/sda), disk dev (/dev/md2) cache mode(WRITE_BACK) capacity(57018M), associativity(512), data block size(4K) metadata block size(4096b) skip sequential thresh(0K) total blocks(14596608), cached blocks(3642185), cache percent(24) dirty blocks(36601), dirty percent(0) nr_queued(0) Size Hist: 512:117531108 1024:61124866 1536:83563623 2048:89738119 2560:43968876 3072:51713913 3584:83726471 4096:41667452 I decided to open my favorite
The diagram is plotted according to the last line, the histogram of the distribution of requests by block sizes.
We all know that
Hard drives usually operate in blocks of 512 bytes. Exactly like AoE. The Linux kernel is 4096 bytes each. Data block size in flascache is also 4096.
Summing up the number of requests with block sizes different from 4096, then it can be seen that the received number suspiciously coincides with the number uncached reads + uncached writes from the flashcache statistics. Only 4K blocks are cached! Remember that MTU was originally 4200? If we subtract the size of the AoE packet header from this, we get the size of the data block at 3584. This means that any request to the disk subsystem will be split into at least 2 AoE packets: 3584 bytes and 512 bytes. What exactly was clearly visible on the original diagram, which I saw. Even on the diagram from the article, the predominance of 512 byte packets is noticeable. And the MTU in 9K recommended at every corner also has a similar problem: the size of the data block is 8704 bytes, these are 2 blocks of 4K and one of 512 bytes (which is exactly what is observed in the diagram from the article). Opanki! The decision, I think, is obvious to everyone.
MTU 8700
The diagram was made several days after updating the configuration on one of the diskless nodes. After updating the MTU on the rest - the situation will become even better. And loadavg on a virtual server with MySQL dropped to 3!
Conclusion
Not being system administrators with 20 years of experience, we solved problems using the “standard” and most popular approaches known to the community at the appropriate time. But in the real world there is always a place for imperfections, crutches and assumptions. To which we, in fact, ran into.
Here is such a story.
Source: https://habr.com/ru/post/158159/
All Articles