Using Data Mining in Sales
There are many companies that sell goods to customers or provide some services. Often, sellers intuitively make decisions on which particular product from the entire existing line is better suited to the customer. It also intuitively determines which array of clients is more interesting for the company, and for which clients the sale and further maintenance will be too costly and unprofitable.
Information analysis using Data mining technology is well suited for a technological understanding of all these issues. By automating customer segmentation through data mining clustering, a company can find answers to many questions.
Consider the option when the company sells goods or services and further after-sales service. Accordingly, the company has potential customers who sell. There are also clients that are serviced or were previously under maintenance, i.e. previously sold. For simplicity, we will call them served clients.
I will briefly describe the purpose and idea. For the analysis it is necessary to take several indicators (15-20) that are potential and serviced customers at the same time. You also need to choose 2-3 indicators that only the clients serve - these are target indicators. Analyze data mining clustering on the array of clients served. At the output we get several clusters with their own characteristics. Next, clusters are grouped into segments by target indicators and give some definitions that are understandable to marketers. We analyze the resulting model, and project the resulting clusters onto potential customers. At the exit we get pro-segmented potential customers. Based on the obtained segments, you can build a sales strategy and methodology for each customer segment.
Let us consider this method and the sequence of steps to achieve the result.
Obviously, a company that thinks about automating such analytics should have a good information system (IS), which will store a lot of data on clients, for example, how many employees are in a company, what kind of activity, is there any accounting, lawyers, etc. In general, an IP can store dozens, hundreds of such indicators, but 15-20 indicators may be sufficient for a specific analysis.
Select indicators that are present at the same time served and potential customers.
The selected indicators should be relevant, i.e. it should be possible to regularly update data on these indicators. If you cannot collect information on any indicator, do not use it in the analysis. Before starting the analysis, collect relevant information, even if this stage takes 1-2 months, it is worth it.
Define several targets of served customers that will uniquely determine whether a customer is attractive to you or not, for example, customer service period, customer profitability, products served, etc. Obviously, these indicators will be characteristic only for the clients served. There may be few such indicators (2-3), the main thing is that this indicator characterizes the desired segment depending on your goals, for example, an attractive business customer in terms of long-term profitability.
In the IC, the values of the selected indicators can be stored in the form of numerical data or a set of different fields. For analysis, it is optimal to combine these values into groups, for example, the number of accountants: 1, 2-5, 6-9, 10 and more.
')
First, work is carried out only with an array of serviced clients. Optimally choose the history of relationships with customers for several years, for example, for 5 or more years. The more customers there are in the sample, the more accurate the result.
Selected clients with their characteristics must be placed in a database, for example in MS SQL Server. In the simplest case, this will be one fact table, where one row is one client, and each field of the table is the indicators selected in the previous step.
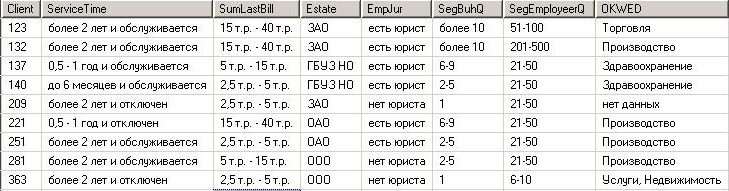
When filling data, most likely they will need to be prepared for analysis, transformed in accordance with the grouping of indicator values carried out earlier.
And in the table you can store these values in the form of text, but more correctly in the form of codes - links to the directory. In the fact table, you can fill the data with scripts on T-sql, using SQL Server Integration Services (SSIS) or in other ways.
Next, you need to create a model for analyzing data mining, for example, using SQL Server Business Intelligence Development Studio (BIDS). A detailed description of the creation of models in BIDS is beyond the scope of this article, I will only note that I use the standard microsoftware clustering algorithm.
At the output we get a certain number of clusters, each of which is characterized by selected indicators of customers.

Each cluster must be described by characteristic values for all indicators used in the analysis, which are typical for potential and served clients. For example, cluster 1 is characterized by the number of accountants 2-5, the budget type of taxation and the type of health care activity. It is important that the description of the cluster contains values for all indicators. It is possible that one indicator will contain several values, for example, in one cluster with a close probability there will be customers with a type of activity health care and education. This is normal, take both values.

Next, we analyze the resulting clusters in the context of the same 2-3 target indicators of serviced clients that were selected earlier. In fact, you can create a table in which each cluster will be described in clear language for sellers. For example, cluster 1 - with clients living an average lifespan and earning a monthly income above average, cluster 2 - with clients living above average and bringing income below the average. All these descriptions and formulations are in the competent field of marketing analyst. Some clusters can be grouped, if they relate to the same group by target indicators. The resulting cluster groups will be called segments.
You must select an array of all potential customers that we want to segment. In general, these are all customers who can be hired by employees for sale.
Then, using specially written program code for each cluster, we successively select potential customers based on the values of the analyzed indicators that they have stored in the IC. For example, cluster 1 is typical: the number of accountants is 2-5, the budget type of taxation and the type of health care activity. We find all customers who have such values in the corresponding fields of the IC and put them in cluster 1.
In practice, there will be three situations:
Consider these situations:
The logic of all comparisons is clear from the Cluster Discrimination tab in the SQL Server Business Intelligence Development Studio model.

At the exit, all potential customers are distributed in different segments. The values of these segments are recorded in the IC. For each segment, the marketing department prescribes a sales strategy and methodology.
It is important that information on clusters is updated regularly. Information in the IC on potential customers changes daily, new customers appear and they need to affix the corresponding segment. All the above logic is placed in the form of a set of program code. Consequently, it is possible to promptly automatically calculate a segment for new customers. Someone needs to do this “on the fly”, when introducing a client to an IP, someone needs to do it once a day, it all depends on the needs of a particular business.
In the future, the resulting algorithm can be made self-learning by integrating Data mining technology directly into the IC. In this case, the clustering model will constantly learn from the new information from the IP obtained from the changing data of the clients being serviced and disconnected, and correct the distribution of potential clients across the clusters.
Information analysis using Data mining technology is well suited for a technological understanding of all these issues. By automating customer segmentation through data mining clustering, a company can find answers to many questions.
Consider the option when the company sells goods or services and further after-sales service. Accordingly, the company has potential customers who sell. There are also clients that are serviced or were previously under maintenance, i.e. previously sold. For simplicity, we will call them served clients.
I will briefly describe the purpose and idea. For the analysis it is necessary to take several indicators (15-20) that are potential and serviced customers at the same time. You also need to choose 2-3 indicators that only the clients serve - these are target indicators. Analyze data mining clustering on the array of clients served. At the output we get several clusters with their own characteristics. Next, clusters are grouped into segments by target indicators and give some definitions that are understandable to marketers. We analyze the resulting model, and project the resulting clusters onto potential customers. At the exit we get pro-segmented potential customers. Based on the obtained segments, you can build a sales strategy and methodology for each customer segment.
Let us consider this method and the sequence of steps to achieve the result.
Select customer records for analysis
Obviously, a company that thinks about automating such analytics should have a good information system (IS), which will store a lot of data on clients, for example, how many employees are in a company, what kind of activity, is there any accounting, lawyers, etc. In general, an IP can store dozens, hundreds of such indicators, but 15-20 indicators may be sufficient for a specific analysis.
Select indicators that are present at the same time served and potential customers.
The selected indicators should be relevant, i.e. it should be possible to regularly update data on these indicators. If you cannot collect information on any indicator, do not use it in the analysis. Before starting the analysis, collect relevant information, even if this stage takes 1-2 months, it is worth it.
Select targets for served clients
Define several targets of served customers that will uniquely determine whether a customer is attractive to you or not, for example, customer service period, customer profitability, products served, etc. Obviously, these indicators will be characteristic only for the clients served. There may be few such indicators (2-3), the main thing is that this indicator characterizes the desired segment depending on your goals, for example, an attractive business customer in terms of long-term profitability.
Group indicator values
In the IC, the values of the selected indicators can be stored in the form of numerical data or a set of different fields. For analysis, it is optimal to combine these values into groups, for example, the number of accountants: 1, 2-5, 6-9, 10 and more.
')
Select clients to create model
First, work is carried out only with an array of serviced clients. Optimally choose the history of relationships with customers for several years, for example, for 5 or more years. The more customers there are in the sample, the more accurate the result.
Selected clients with their characteristics must be placed in a database, for example in MS SQL Server. In the simplest case, this will be one fact table, where one row is one client, and each field of the table is the indicators selected in the previous step.
When filling data, most likely they will need to be prepared for analysis, transformed in accordance with the grouping of indicator values carried out earlier.
And in the table you can store these values in the form of text, but more correctly in the form of codes - links to the directory. In the fact table, you can fill the data with scripts on T-sql, using SQL Server Integration Services (SSIS) or in other ways.
Create a model for analysis
Next, you need to create a model for analyzing data mining, for example, using SQL Server Business Intelligence Development Studio (BIDS). A detailed description of the creation of models in BIDS is beyond the scope of this article, I will only note that I use the standard microsoftware clustering algorithm.
At the output we get a certain number of clusters, each of which is characterized by selected indicators of customers.
Highlight the characteristic values for the resulting clusters.
Each cluster must be described by characteristic values for all indicators used in the analysis, which are typical for potential and served clients. For example, cluster 1 is characterized by the number of accountants 2-5, the budget type of taxation and the type of health care activity. It is important that the description of the cluster contains values for all indicators. It is possible that one indicator will contain several values, for example, in one cluster with a close probability there will be customers with a type of activity health care and education. This is normal, take both values.
Merge clusters into segments
Next, we analyze the resulting clusters in the context of the same 2-3 target indicators of serviced clients that were selected earlier. In fact, you can create a table in which each cluster will be described in clear language for sellers. For example, cluster 1 - with clients living an average lifespan and earning a monthly income above average, cluster 2 - with clients living above average and bringing income below the average. All these descriptions and formulations are in the competent field of marketing analyst. Some clusters can be grouped, if they relate to the same group by target indicators. The resulting cluster groups will be called segments.
Select potential customers
You must select an array of all potential customers that we want to segment. In general, these are all customers who can be hired by employees for sale.
Distribute potential customers to clusters
Then, using specially written program code for each cluster, we successively select potential customers based on the values of the analyzed indicators that they have stored in the IC. For example, cluster 1 is typical: the number of accountants is 2-5, the budget type of taxation and the type of health care activity. We find all customers who have such values in the corresponding fields of the IC and put them in cluster 1.
In practice, there will be three situations:
- the client uniquely corresponds to only one cluster;
- the client corresponds to two or more clusters;
- The client does not fall into one cluster.
Consider these situations:
- When one client enters only one cluster, we put down the necessary cluster value for it and forget about it.
- When a client corresponds to two or more clusters, it is necessary to analyze which cluster the client corresponds to a greater degree. We know what values of indicators, in varying degrees, characterize the compared clusters. And we know the values of indicators for a particular client. From here it is definitely possible to determine which cluster is closer to the client; there we place it. Obviously, this should not be done manually for all clients, but programmatically analyzing options for possible intersections between clusters.
- When a client does not explicitly fall into any cluster, it is necessary to expand the options for the values of indicators characterizing the cluster. Further, according to advanced features, you can determine which cluster the client belongs to. For example, cluster 1 in terms of the “Number of accountants” indicator is characterized to a greater degree by the value “2-5”, but also the value “6-9” is less characteristic of this cluster. This value is added to the advanced analysis.
The logic of all comparisons is clear from the Cluster Discrimination tab in the SQL Server Business Intelligence Development Studio model.
results
At the exit, all potential customers are distributed in different segments. The values of these segments are recorded in the IC. For each segment, the marketing department prescribes a sales strategy and methodology.
It is important that information on clusters is updated regularly. Information in the IC on potential customers changes daily, new customers appear and they need to affix the corresponding segment. All the above logic is placed in the form of a set of program code. Consequently, it is possible to promptly automatically calculate a segment for new customers. Someone needs to do this “on the fly”, when introducing a client to an IP, someone needs to do it once a day, it all depends on the needs of a particular business.
In the future, the resulting algorithm can be made self-learning by integrating Data mining technology directly into the IC. In this case, the clustering model will constantly learn from the new information from the IP obtained from the changing data of the clients being serviced and disconnected, and correct the distribution of potential clients across the clusters.
Source: https://habr.com/ru/post/158047/
All Articles