Control of mobile communication expenses within the organization: implementation

I would like to tell you some technical details of creating a mobile spending control system, the concept of which was described in a previous post.
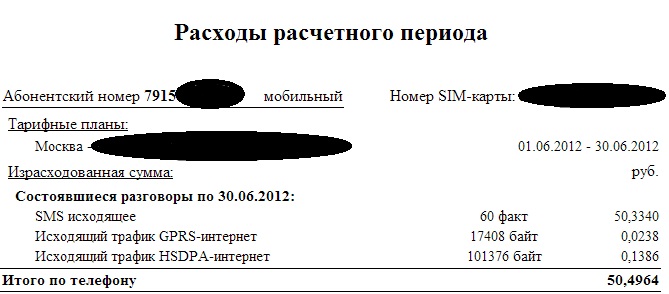
As an example, we will consider the invoice for one of the months from MTS and create a simple OLAP project.
Judging by the responses, this topic is quite relevant, so who are interested, I ask under the cat.
We take information on expenses from the invoice file, or rather from its consolidated part for each number:
')
From the file we extract:
- phone number
- ICCID - sim card id
- invoice period
- summary of communication services with amounts
We also extract from the account “header”:
- personal account
- provider name
We will skip the description of the parser for extracting all this data, due to the fact that in each region and each provider the format of the accounts will differ and universal software simply can not be.
You can pay attention to some features, namely:
- to check the correctness of the parser, it is necessary to build a comparison of the total amount for each number and the amounts of the components by type of consumption
- ICCID is the only unique id for each sim. Over time, voice numbers may change, but the ICCID remains constant. The most correct way to build connections is for this parameter.
- personal account - if possible, SIM cards used in different components of your system are “hung up” on different l / s (employees, m2m devices, communication for servers, etc.), so it will be most convenient to track expenses
We import data into the sql table in accordance with the above components.
Raw data data looks like this:

If you select all the unique values by the type of traffic, then we get a list of several hundred lines, which can in no way contribute to the comfortable work of the analyst.
Below is only a small part of the data. You can see, for example, that within network roaming is indicated for each city separately.

It is necessary to bring data on the type of connection to the standard 10-15 values.
This can be done through the case statement, analyzing all possible variants of one value, for example:
CASE WHEN rom.SERVICEDESCRIPTION LIKE '%%sms%' THEN ' ' WHEN (rom.SERVICEDESCRIPTION LIKE '%sms%' AND rom.SERVICEDESCRIPTION NOT LIKE '%%') THEN '' WHEN (((rom.SERVICEDESCRIPTION LIKE '%gprs%' OR rom.SERVICEDESCRIPTION LIKE '% %') and rom.SERVICEDESCRIPTION not LIKE '%hsdpa%') AND rom.SERVICEDESCRIPTION NOT LIKE '%%') THEN 'gprs' WHEN ((rom.SERVICEDESCRIPTION LIKE '%%gprs%' OR rom.SERVICEDESCRIPTION LIKE '%% %') and rom.SERVICEDESCRIPTION not LIKE '%%hsdpa%') THEN ' gprs' WHEN ((rom.SERVICEDESCRIPTION LIKE '%hsdpa%') AND rom.SERVICEDESCRIPTION NOT LIKE '%%') THEN 'hsdpa' WHEN (rom.SERVICEDESCRIPTION LIKE '%%hsdpa%') THEN ' hsdpa' WHEN ((rom.SERVICEDESCRIPTION LIKE '% %' OR rom.SERVICEDESCRIPTION LIKE '%%%' OR rom.SERVICEDESCRIPTION LIKE '%. %' OR rom.SERVICEDESCRIPTION LIKE '% , , WAP %') AND rom.SERVICEDESCRIPTION NOT LIKE '%%') THEN ' ' WHEN (rom.SERVICEDESCRIPTION LIKE '%% %' OR rom.SERVICEDESCRIPTION LIKE '%%%%' OR rom.SERVICEDESCRIPTION LIKE '%%. %' OR rom.SERVICEDESCRIPTION LIKE '% .%') THEN ' ' WHEN rom.SERVICEDESCRIPTION LIKE '%% %' THEN ' ' WHEN ((rom.SERVICEDESCRIPTION LIKE '% %') AND rom.SERVICEDESCRIPTION NOT LIKE '%%') THEN ' ' WHEN rom.SERVICEDESCRIPTION LIKE '% %' THEN ' ' WHEN rom.SERVICEDESCRIPTION LIKE '%%' THEN '' ELSE '' END As a result, we obtain the standard values:

Next, we need to convert text values by the amount of traffic to numeric
Using the same case statement
CASE WHEN rom.serviceqtydescription LIKE '0.00 ' THEN '0' WHEN rom.serviceqtydescription LIKE '%.%.%' THEN '1' WHEN rom.serviceqtydescription LIKE ' ' OR rom.serviceqtydescription LIKE '' THEN '0' WHEN rom.serviceqtydescription LIKE '%' THEN CAST(replace(rom.serviceqtydescription, ' ', '') AS numeric(20, 2)) WHEN rom.serviceqtydescription LIKE '%.' THEN CAST(replace(rom.serviceqtydescription, ' .', '') AS numeric(20, 2)) WHEN rom.serviceqtydescription LIKE '%. 0 .' THEN CAST(replace(rom.serviceqtydescription, ' . 0 .', '') AS numeric(20, 2)) WHEN rom.serviceqtydescription LIKE '%' THEN CAST(replace(rom.serviceqtydescription, ' ', '') AS numeric(20, 2)) / 60 WHEN rom.serviceqtydescription LIKE '%' THEN CAST(replace(rom.serviceqtydescription, ' ', '') AS numeric(20, 2)) WHEN rom.serviceqtydescription LIKE '%' THEN CAST(replace(replace(rom.serviceqtydescription, ' ', ''),',','.') AS numeric(20, 2)) / 1024 WHEN (rom.serviceqtydescription LIKE '%.% ' AND rom.serviceqtydescription NOT LIKE '0.0 ') THEN CAST(replace(rom.serviceqtydescription, ' ', '') AS numeric(20, 2)) * 1024 WHEN rom.serviceqtydescription LIKE '%' THEN CAST(replace(rom.serviceqtydescription, ' ', '') AS numeric(20, 2)) when rom.serviceqtydescription = ' ' then 0 ELSE CAST(replace(rom.serviceqtydescription, ' ', '') AS numeric(20, 2)) END AS We get: SMS in pieces, voice in minutes, data transmission in killobytes
The final table looks like this.

Now the data on the amounts and traffic amenable to arithmetic operations.
In this form, the data is already quite amenable to analysis either from the managment studio window, or through the Excel interface, connecting the database as an external data source.
As you understood, we made a fact table for the future of OLAP Cuba.
To create a simple Cuba, you need to select the measurements from the fact table:
- period
- personal account
- phone
- provider
- traffic type
It is highly desirable to output the data into separate tables — directories with a separate primary key of the int format and replace the values in the fact table with the corresponding values from the directories. Values in reference books should be unique.
All of the above does not apply to the directory of time, it is generated on the server separately.
We start the creation of the OLAP project
In BIDS, you need to create a new data mining project.
Create a new data source named DWH

Create a data source view where we add our tables.

In this example, there is no provider table, but it is added in the same way. And also I didn’t follow the recommendations with the keys on the field of the int format - it will work but with large amounts of data it will affect the speed.
I will not describe the creation of the time dimension, there is enough information in the network about this.
The next step is to create a cube, for this we launch the creation wizard.
On the first screen, select - use existing tables.
Next you need to select our measurement table and follow the wizard.


After creating the cube, measurements will automatically be added.
The cube will take the following form:

Also, you need to double-click the time dimension and drag the necessary time components to the attributes section:

And also, if necessary, create hierarchies

You can begin to deploy the cube on the server, to do this, click on the project and start processing.
After processing, you can connect to the cube via Excel, it is done this way:
Data - from other sources - from analytics services, in the wizard we enter the name of the server to which we deployed the cube.
The solution described is not perfect, experts in the sql field, and BI will point out many flaws, but I hope that this description will allow people who are not familiar with building a business analytics system to start doing this.
Source: https://habr.com/ru/post/157871/
All Articles