Control of mobile expenses within the organization
It will not be news that controlling the costs of communication in an organization with more than twenty SIM cards is not easy, and many prefer to just pay without bothering with cost analysis.
There are specialized products on the market that allow you to track costs mainly in manual mode.
I would like to share the experience of creating a cost control system for several hundred thousand SIM cards based on MS SSAS.
As a field for action, a company was selected, which at that time had about 120 thousand SIM cards, 90% of which were providers with the logo in the form of eggs and installed in m2 device.
Having a little bit gone into work with mobile providers, the process looked like this:
I wanted to build a process like this:
The first thing to do is load the data into the database. The organization used Axapta, in its base and it was decided to store data from providers. The program code with the help of which the data from the html accounts got into the database will not be described, since I did not write it and the essence of the post is not in this.
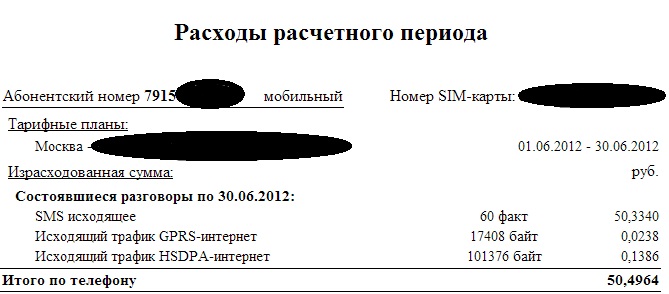
The file coming from the provider in html format is divided into two components: the details for the past period and a summary for each number on charges. Summary as a result, we will ship to the database.
As a result, we will pull out information from such a file:
')
In the database, create a table of this type:
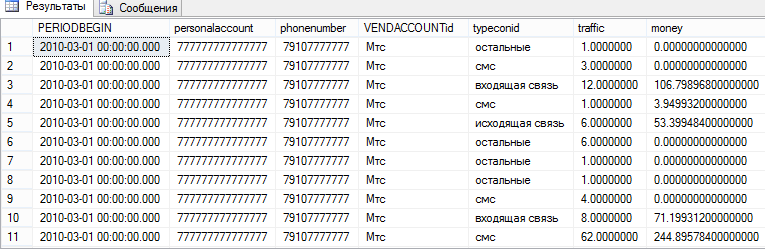
And load the data from our accounts there.
It turns out like this:
The [typeconid] field must first be reduced to the standard 8-10 values, otherwise we risk having several hundred types of communication, since about the same type of communication provider can be called differently, for example: "outgoing" and "outgoing." or "Content category .. (and category number) ..".
done with case:
As a result, we obtain a fact table for our cube.
Next you need to design measurements.
Each SIM card in an organization has the following properties:
Part of the measurements taken from the fact table: personal account, provider, type of communication
We extract a part from our database by making the required tables join.
Next, set up an incremental update of the measurement tables from the operating database to the storage. Here, someone like you can use timestamp, cdc, to retrieve only the changed data.
My tables are not big and I used the usual left join to pull out the difference between the two tables.
As a result, the parameters were summarized in one table with the primary key along the "telephone" field:

Where the parameters are not known, replace the values with 'n / a'.
Open BIDS and create a new data mining project.
As a data source, we connect the database with the created tables.
Add a fact table and dimension tables to the data source view.
I made several more measurements by analogy with the one described, and also the time table remained with me from another project.
We create links from the fact table to dimension tables, and the keys in the dimension tables do not have to be physical, they will be added as logical when creating a link.

Next, create a cube:

Since “Kubom” is used in different regions, it is necessary to differentiate rights. I did this by measuring the “contract sim”, creating a separate role for each region and writing the following on the “measurement data” tab (example for the Urals):

And be sure to turn on the checkbox "activate visual results"
As a result, each region can see only its SIM cards and its expenses.
Analysts connect to the cube via Excel and view expenses.
Below are some screenshots of how this looks through the eyes of an analyst:
Interface - the usual pivot table

Three month expenses by type of communication

Spending on the sim for the month, clearly visible "peaks" with which you need to understand.

Traffic report by one of the sim (numbers in minutes)

At the moment, the system is used in 7 regions of the Russian Federation.
In the first two months after the introduction of the system, expenses were reduced by about 20% and this is not the limit.
This topic is not intended to describe in detail the creation of an OLAP cube, but only describes a concept that can be implemented in any company with a large number of SIM cards.
The system can be improved using MDX queries, pulling out "interesting" cases and processing them.
If there is interest in the article, you can expand the technical details of the project.
There are specialized products on the market that allow you to track costs mainly in manual mode.
I would like to share the experience of creating a cost control system for several hundred thousand SIM cards based on MS SSAS.
As a field for action, a company was selected, which at that time had about 120 thousand SIM cards, 90% of which were providers with the logo in the form of eggs and installed in m2 device.
Idea
Having a little bit gone into work with mobile providers, the process looked like this:
- we receive the electronic version of the account for communication on mail
- we get a paper original
- we pay
- mailbox is not rubber, delete electronic copies
I wanted to build a process like this:
- we receive the electronic version of the account for communication on mail
- we load into base, we analyze
- re-expose unreasonable costs (provider or one who uses the sim)
- we pay
Decision
The first thing to do is load the data into the database. The organization used Axapta, in its base and it was decided to store data from providers. The program code with the help of which the data from the html accounts got into the database will not be described, since I did not write it and the essence of the post is not in this.
The file coming from the provider in html format is divided into two components: the details for the past period and a summary for each number on charges. Summary as a result, we will ship to the database.
As a result, we will pull out information from such a file:
')
In the database, create a table of this type:
CREATE TABLE [dbo].[month_money_traffic]( [PERIODBEGIN] [datetime] NOT NULL, -- [personalaccount] [nvarchar](20) NOT NULL, -- [phonenumber] [nvarchar](12) NULL, -- [VENDACCOUNT] [varchar](7) NULL, -- [typeconid] [varchar](50) NOT NULL, -- [traffic] [numeric](30, 7) NULL, -- [money] [numeric](32, 14) NULL -- ) And load the data from our accounts there.
It turns out like this:
The [typeconid] field must first be reduced to the standard 8-10 values, otherwise we risk having several hundred types of communication, since about the same type of communication provider can be called differently, for example: "outgoing" and "outgoing." or "Content category .. (and category number) ..".
done with case:
case when [typeconid] like ' %' then '' case when [typeconid] like '%' then ' ' else [typeconid] end As a result, we obtain a fact table for our cube.
Next you need to design measurements.
Each SIM card in an organization has the following properties:
- location (in m2m device, issued to the employee, in servers, etc.)
- status (active, blocked)
- region service, sales
- provider
- contract (legal person who pays the bill)
- etc
Part of the measurements taken from the fact table: personal account, provider, type of communication
We extract a part from our database by making the required tables join.
Next, set up an incremental update of the measurement tables from the operating database to the storage. Here, someone like you can use timestamp, cdc, to retrieve only the changed data.
My tables are not big and I used the usual left join to pull out the difference between the two tables.
As a result, the parameters were summarized in one table with the primary key along the "telephone" field:
Where the parameters are not known, replace the values with 'n / a'.
Open BIDS and create a new data mining project.
As a data source, we connect the database with the created tables.
Add a fact table and dimension tables to the data source view.
I made several more measurements by analogy with the one described, and also the time table remained with me from another project.
We create links from the fact table to dimension tables, and the keys in the dimension tables do not have to be physical, they will be added as logical when creating a link.
Next, create a cube:
Since “Kubom” is used in different regions, it is necessary to differentiate rights. I did this by measuring the “contract sim”, creating a separate role for each region and writing the following on the “measurement data” tab (example for the Urals):
And be sure to turn on the checkbox "activate visual results"
As a result, each region can see only its SIM cards and its expenses.
Analysts connect to the cube via Excel and view expenses.
Below are some screenshots of how this looks through the eyes of an analyst:
Interface - the usual pivot table
Three month expenses by type of communication
Spending on the sim for the month, clearly visible "peaks" with which you need to understand.
Traffic report by one of the sim (numbers in minutes)
At the moment, the system is used in 7 regions of the Russian Federation.
In the first two months after the introduction of the system, expenses were reduced by about 20% and this is not the limit.
This topic is not intended to describe in detail the creation of an OLAP cube, but only describes a concept that can be implemented in any company with a large number of SIM cards.
The system can be improved using MDX queries, pulling out "interesting" cases and processing them.
If there is interest in the article, you can expand the technical details of the project.
Source: https://habr.com/ru/post/157607/
All Articles