Moscow traffic jams from the height of the monthly flight
I wanted to go ahead and do something that would allow us to estimate the congestion of roads not from the “here and now” position, but in general in a month. In other words, to answer the question "what is the overall road situation and how does it depend on the season".
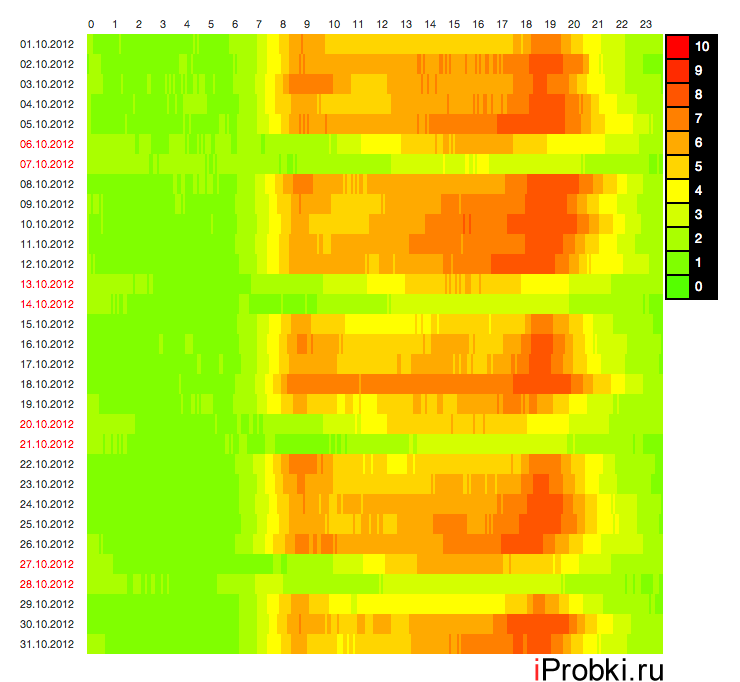
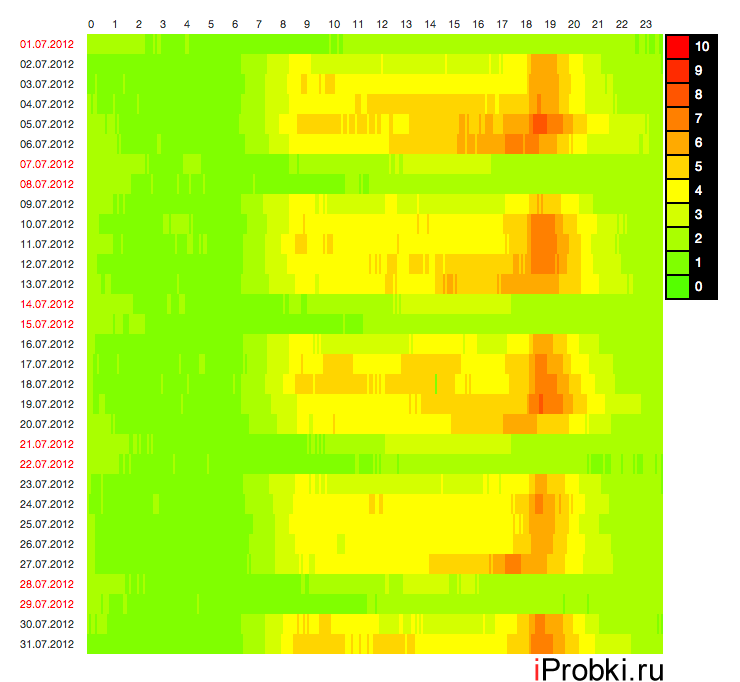
The result was a graph that reflects what was happening with the traffic situation during the month. On the horizontal axis are the clock, on the vertical date. The color indicates road congestion on a 10-point scale. One "line" of this schedule corresponds to the general traffic situation during the day.
For example, October looks like this:
')
And so it looks, the least loaded month, July:
The remaining months can be viewed on the website iprobki.ru
Source: https://habr.com/ru/post/156991/
All Articles