Intel® Inspector XE 2013: Automatic Real-Time Verification and Debugging

Testing and finding bugs is an integral and not the most interesting part of the software development process. To get rid of the routine, everyone tries to automate this process. And if specialized self-made tests are created to check the functionality of the application, the search for errors of a general type is not always covered by them. For example, is your application checked for memory leaks or data races? This article will look at how to use the updated Inspector XE 2013 in two ways:
- For regular automatic testing (regression testing)
- To manually search for the causes of the problem in a pair with a debugger
Why do I need Inspector XE?
Inspector XE is a tool for analyzing the correctness of code from Intel Parallel Studio XE, but it is also supplied as a separate product. Its purpose is to search for memory errors (leaks, access to uninitialized memory, etc.) and problems caused by the interaction of streams (data races, deadlock, etc.). At the same time, the problem does not have to show itself - if there is a potential deadlock (interlocking), Inspector XE will find it, even if the program does not “hang” (but the code branches in which it may occur are executed).
')

The inspector uses dynamic analysis, i.e. not the source code is analyzed, but the executable process. During execution, the inspector analyzes what happens in the application, how it allocates and frees the memory, creates threads, uses synchronization objects, etc., and then gives the programmer a list of the problems found:
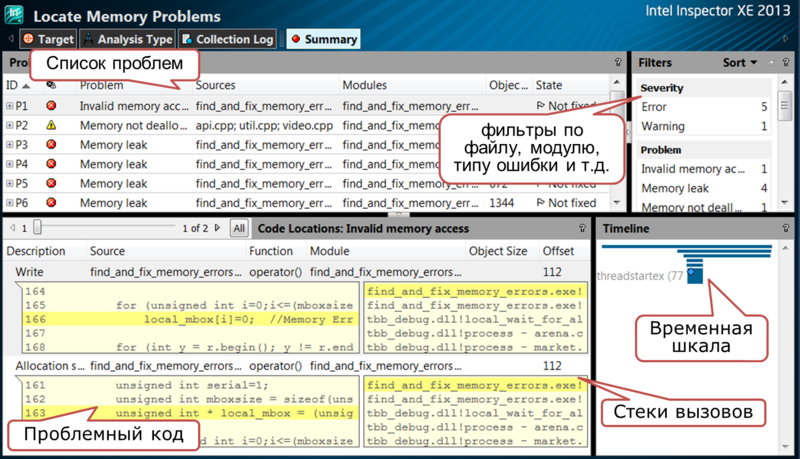
A separate problem can be studied in more detail in the source view:

Static source code analysis is also available, but it is executed by the Intel compiler. And Inspector XE displays, visualizes analysis results, allows them to filter, manage the state of problems, etc. In this post we will not discuss this topic.
By the way, Inspector XE works with code in C / C ++, C # and Fortran. Available for two operating systems: Windows * and Linux *. Both have two interfaces: GUI and command line. In addition, in Windows it also integrates into Microsoft Visual Studio *.
You can inspect, in principle, any executable file. However, there are several recommendations to increase the likelihood of finding problems, see them in the source code and not spend too much time on it:
- Compile with / MDd, / ZI, / Od keys and link with / DEBUG and / FIXED: NO (using the example of Microsoft compiler and linker). Binding of binaries and sources requires symbolic information, and optimization should be turned off so that the Inspector XE is not confused by the compiler.
- To search for multithreading errors, if possible, reduce the load on the application. For example, minimize the size of the input data. This will save time, because Inspector XE slows down the program - the costs of dynamic analysis and binary instrumentation. Reducing the load will not affect the result, because the inspector is looking for potential interoperability problems.
- To search for memory errors, on the contrary, it is better to use the full set of data, since for this type of errors, real problems are detected.
- Pick tests that activate different branches of the code. If the code branch was not executed, it will not be analyzed.
Automated Testing
Inspector XE is a verification tool. And in order to maintain the quality and stability of software at a high level, verification should be carried out regularly. You can, for example, run a test by an inspector during a night regression test. To do this, use the command interface tool. The syntax for Inspector XE for Linux * and Windows * is the same. An example of starting the analysis of a test application in Windows:
inspxe-cl -collect mi3 -knob resources=true -knob still-allocated-memory=true -knob stack-depth=16 -knob analyze-stack=true -- D:\tests\testapps\mem_error.exe The command line always starts with the launch of the inspector itself - “inspxe-cl”. The key “-collect” says that the analysis should be run, “-mi3” - the type of analysis (search for memory errors, or “Locate memory problems”). Next are the other parameters of the analysis and the path to the analyzed application. Full syntax and parameter reference can be printed with the command “inspxe-cl -help”. In addition, if you are already working in the GUI and want to run the same analysis on the command line, there is a “Command line” button that will form a ready-made command line for the analysis configured in the GUI.
After completing the analysis, Inspector XE will create a folder with the results files. They can be viewed in the GUI, and the results collected on Linux can be viewed on another Windows machine (and vice versa). However, a simple run of the analysis from the script, followed by a manual review of the results is not full automation. Therefore, the inspector has the ability to print information about problems found in the CLI:
inspxe-cl -report problems -r D:\tests\testapps\r002mi3 P1: Error: Mismatched allocation/deallocation New Problem P1.1: Mismatched allocation/deallocation D:\tests\testapps\mem_error.cpp(48): Error X10: Allocation site: Function start: Module D:\tests\testapps\mem_error.exe D:\tests\testapps\mem_error.cpp(49): Error X9: Mismatched deallocation site: Function start: Module D:\tests\testapps\mem_error.exe P3: Error: Invalid memory access New Problem P3.1: Invalid memory access D:\tests\testapps\mem_error.cpp (40): Error X4: Allocation site: Function start: Module D:\tests\testapps\mem_error.exe D:\tests\testapps\mem_error.cpp (42): Error X5: Deallocation site: Function start: Module D:\tests\testapps\mem_error.exe D:\tests\testapps\mem_error.cpp (44): Error X3: Read: Function start: Module D:\tests\testapps\mem_error.exe If the plain text is not suitable, you can export to csv, or print it in XML format, so that you can parse with all sorts of Perl and Python:
inspxe-cl -report problems –format=xml -r D:\tests\r002mi3\ <?xml version="1.0" encoding="UTF-8"?> <pset id="P1" type="Mismatched allocation/deallocation" state="New" severity="Error"> <obs id="X1" type="Allocation site" state="New" severity="Error"> <stack id="10"> <frame id="" module=" D:\tests\testapps\mem_error.exe" file="D:\tests\testapps\mem_error.cpp“ func="start" line="48"/> <frame id="" module=" D:\tests\testapps\mem_error.exe " file="D:\tests\testapps\mem_error.cpp“ func="start1" line="84"/> <frame id="" module="C:\Windows\syswow64\kernel32.dll“ func="BaseThreadInitThunk" line="78792"/> </stack> </obs> <obs id="X2" type="Mismatched deallocation site" state="New" severity="Error"> <stack id="9"> <frame id="" module=" D:\tests\testapps\mem_error.exe " file="D:\tests\testapps\mem_error.cpp“ func="start" line="49"/> <frame id="" module=" D:\tests\testapps\mem_error.exe " file="D:\tests\testapps\mem_error.cpp“ func="start1" line="84"/> </stack> </obs> </pset> Of the variety of problems, of which quite a lot can be found on a large project, it is still necessary to filter out new and noteworthy ones. Inspector XE has the ability to assign status problems (New, Confirmed, Fixed, etc.). If the project is inspected regularly, then the dynamics are interesting first of all - has something new appeared after the recent changes? For such a case, Inspector XE can combine information about problems from different launches, giving a summary of the changes:
inspxe-cl –merge-states D:\tests\r000mi3\ -r D:\tests\r001mi3\ inspxe-cl -report status -r D:\tests\r001mi3\ 9 problem(s) found 3 Investigated 6 Not investigated Breakdown by state: 2 Confirmed 1 Not a problem 4 Not fixed 2 Regression Inspector XE can be very useful for finding potential “multithreading errors”. Consider a simple C ++ example with data race. The loop is parallelized using OpenMP. The space of iterations is divided into small portions and can be executed in parallel:
#pragma omp parallel for shared(j) for(i=0; i<MAX; i++) { printf("j=%d ", j++); } if(j != MAX) printf(“error\n”); So that this race sometimes manifests itself, it took us to use MAX> 1,000,000,000, the test worked for more than 10 minutes. Inspector XE finds such a problem with MAX = 10 and in 10 seconds, because looking for potential data races. The example is, of course, highly refined, but can be used for illustration. In such cases, the inspector will increase the effectiveness of the test run — more problems found per unit time.
To narrow the search area, only some application modules can be analyzed:
inspxe-cl -collect mi1 -module-filter module1.dll,module2.dll -module-filter-mode exclude -- D:\tests\testapps\mem_error.exe The “-module-filter-mode” parameter determines whether we want to exclude the specified modules from the analysis (exclude) or vice versa, to analyze only them (include).
If you need to analyze a child process - for example, if an application is launched from a script, use the “-executable-of-interest” option:
inspxe-cl -collect mi1 -executable-of-interest mem_error.exe -- D:\tests\testapps\startup_script.bat The results obtained from the inspector may use different team members. To transport the result, use the “export” option. It packs the result into one archive, along with some source codes, so that you don’t have to configure the project, file paths, etc: on another machine:
inspxe-cl -export -archive-name my-new-archived_result.inspxez -include-sources -result-dir myRes For teamwork can also be useful:
- Ability to make text reports and comments about problems
- Protection against simultaneous editing of results by different users
- General rules of repression. If, for example, the inspector found a problem in another module (system library), which you are not going to fix, you can mark it specifically - suppress it so that it does not litter the result. Suppression rules are stored in a special file that can be shared by the whole team.
Everything. Now it remains to integrate the launch of Inspector XE and the parsing of analysis results into scripts that perform night testing, but this is individual and is not covered in this post.
Inspector + debugger = two pair of boots
Another use model for Inspector XE is to search for problems manually to get to the bottom of its cause. Perhaps there is some kind of bug in the program - sometimes it hangs or falls. Or night testing by the inspector found a new problem that needs to be studied. Or you just decided to sit down and check once again the reliability of your creation.
In these cases, Inspector XE integration with debuggers will be useful. This functionality appeared not so long ago - in version 2013. At the moment, integration with gdb debuggers and Intel Debugger on Linux * and Visual Studio Debugger on Windows * is supported.
If we are looking for an unknown problem (something in the application is sometimes buggy), to launch the inspector together with the debugger in the analysis settings, select “Enable debugger when problem detected”:

Now we run the analysis and wait - as soon as a problem is found, Inspector XE will stop the execution, and you can dig into it with a debugger. This will be done for all problems found.
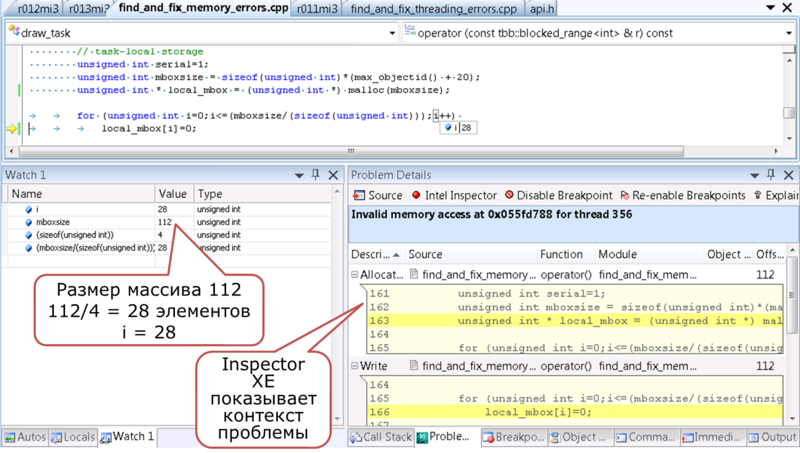
If we have already set our sights on some kind of bug found on night testing, open the analysis results in the inspector, right click on the problem, select “Debug This Problem”. Inspector XE will launch the same analysis again, and as soon as the noted problem manifests itself again, you will be loaded into the debugging session at the place of its origin:
You can also set your breakpoint and select the third option to start the debugger in the configuration of the inspector's analysis:

In this case, Inspector XE will not analyze anything until execution stops at this breakpoint. And if you select "Continue with Inspector XE” in the Debug menu (Visual Studio), the execution will continue, but already with inspection. Then everything will go according to the first scenario, with a stop at each found problem. This is useful in order to reduce the analysis time and eliminate uninteresting code in this context (for example, long initialization).
Summary
Inspector XE is a versatile tool for finding memory errors and multi-threaded execution. Due to dynamic analysis, quite complex, deep-seated problems can be detected. Because of it, the time of the program execution under the analysis can increase significantly. Inspector XE 2013 can be used to work in the GUI, paired with a debugger, helping to find the roots of tricky problems, and for automated verification. But in both cases it serves to increase the stability of the code - the more problems there are and the sooner it is done, the more reliable the finished application will be.
Intel Inspector XE
Intel Parallel Studio XE 2013
Inspector XE 2013 documentation
Source: https://habr.com/ru/post/156289/
All Articles