BI in Odnoklassniki: data collection and delivery to DWH
Last time (http://habrahabr.ru/company/odnoklassniki/blog/149391/) we talked about a system of graphs and dashboards that we use to monitor the site and user activity. We have to log more than two trillion (2,000,000,000,000) events per day. In this post, we will describe how we collect this data, process it, and load it into the repository.
In the monitoring system, we collect data that is not tied to a specific user. We aggregate data by classifiers (one or several per table), which allows to significantly compress their total volume. At the same time, we practically lose nothing - information about the total activity of all users at a certain point in time is sufficient.
We also do not log the exact time of the event, but aggregate data by five minutes. It also allows you to significantly reduce the amount of data and create graphics, more "light" for perception and display in the browser.
')
Almost on each server of our site (and there are more than 4000 of them), in each application, the Logger library is used based on Log4j, which aggregates all the logs in asynchronous mode into tables, five-minutes and classifiers. Aggregation is carried out in memory, that is, work with the disk does not occur at all.
As a result of aggregation, we compress the data 1000 times - instead of 20 billion records in 5 minutes during rush hour we get only 20 million records. This, to put it mildly, is a very big difference.
Every five minutes, the Logger flushes the aggregated data to the intermediate data store, and then deletes it from memory. Moreover, it is necessary to reset these data in 2 minutes so that they reach the end user as quickly as possible and that there is a reserve of capacity (the maximum time allowed for data reset is 5 minutes, after which the data for the next five minutes will begin to reset).
Let's compare the two approaches. The average record length is 200 bytes.
1) Non-aggregated data
the amount of data per second - 20 000 000 000 (records) * 200 (bytes) / 120 seconds = 33 GB / sec
the amount of data per day - 2 000 000 000 000 (records) * 200 (bytes) = 400 TB / day
2) Aggregated data
the amount of data per second is 20,000,000 (records) * 200 (bytes) / 120 sec = 33 MB / sec
the amount of data per day - 2 000 000 000 (records) * 200 (bytes) = 400 GB / day
If we did not aggregate the data, then only for statistics we would need 33 GB * 8 = 264 Gb / s of network capacity.
With this approach, we use part of server resources (CPU and memory) to aggregate data, but since this part is very small, this does not really bother us.
If there were no intermediate storage, then the share of DWH servers would have 4000 parallel sessions that would write data at a speed of 33 MB per second. In parallel with this load, it would be impossible to do any data processing.
The task of intermediate data storage:
1) quickly save the data from 4000 Logger-applications;
2) quickly send fresh data to DWH-servers;
3) quickly delete old data after it is uploaded to DWH.
Although it sounds simple, we didn’t come right away to the architecture of the intermediate data warehouse that we have now and which suits us.
In 2008, we did not have a DWH yet, but there were 300 servers that wrote their logs into one database with 20 tables. A separate application generated graphs, referring directly to the data in the same database. Each table had a clustered index by date and time to ensure fast reading over a specific period.
As the number of servers and the amount of data increased, graphics began to be generated more and more slowly. They could easily load the base so that it stopped accepting new records. Therefore, we decided to create a separate data warehouse that will download data from this database and efficiently serve queries from business analysis applications.
Our new system was pumping data from the database of logs, which we began to call “intermediate storage”. The data structure was not changed, because it was necessary that the old graphics and Logger continued to work without changes.
Data for uploading we filtered by date and time. At the same time there was a lot of data with the same time, and they appeared asynchronously. It was necessary to unload data with a "large margin of safety." Therefore, we added a bigint ID column with auto-increment to each table and created an index on this column. After that, we could download one record only once.
It worked well for a while. The number of servers has grown to 700. And suddenly it turned out that the base of the logs is “not rubber” - the disk space ended. Old logs that were uploaded to DWH had to be deleted, but there was no effective way to do this. The DELETE command is impossible, because on large volumes it is too heavy and slow operation. I had to delete the records by re-creating the tables, which led to data loss and inaccessibility of the service.
The number of servers and data volumes grew rapidly. Old logs in such an inefficient way had to be deleted more and more often. This turned into a real problem that had to be solved, and preferably in such a way that neither Logger nor DWH had to rewrite.
We could do this with the help of views and triggers.
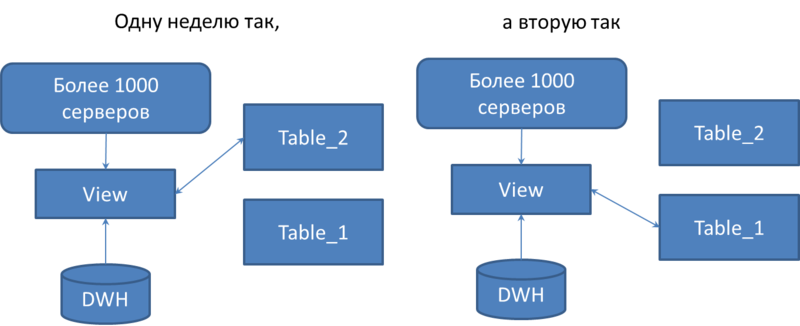
For each table, an identical pair was created and renamed, adding the ending _1 and _2. Created a view with the same name as the original table. Servers write to this view. A trigger instead of insert was added to the view. It writes to the table with the end of _1 one week, and the second week - to the table with the end of _2.
Switching occurs in two stages. At first, only the trigger is switched, and the view itself reads data from the previous table. After DWH has downloaded all the data from the previous table to itself, the view is switched.
After that, the data from the old tables is effectively deleted by the truncate table command.
Thus, we got a solution that allowed deleting data without downtime and data loss, without requiring a change to the Logger.
Over time, the old charting system was no longer used, that is, there was no need for a clustered index by date and time. Therefore, we deleted it and made the index by ID cluster. Thanks to this, the system has become even more efficient.
The number of servers has exceeded 3,000. The solution with views and triggers has become very load on the server's CPU with a fairly low disk queue. It was necessary to reduce the load, but the presence of triggers did not allow it. We decided that it was necessary to remake Logger, so that one week he would write in tables with _1, and the second - in _2. So did.
Part of the infrastructure was transferred to the new Logger. The load on the CPU has dropped, but the disk queue has grown to a critical level. The structure of the base is very simple - there is nothing to improve. We had to look for another solution.
The disk queue was created by MS SQL Log Manager, working with the database log file. At that moment we had a MS SQL 2005 Standard Edition database. Experts argued that MS SQL 2008 Log Manager is an order of magnitude better than MS SQL 2005. We decided to check this and switched to MS SQL 2008 Enterprise Edition. Disk queue really dropped by an order!
At the same time, we decided to use partitioning tables to delete data. That is, they returned to the 2009 model, but only the cluster index by ID was divided into partitions of 20,000,000 records. After the partition is 100% full and all DWH servers have downloaded data, these partitions are deleted.
Partitions in SQL servers are “invisible” to developers, and this solution does not complicate the code. Deleting and adding partitions occurs online, no loss of connections and data.
The result is the following architecture:

Intermediate storage in the schema called Logs bases. All of them are identical in structure and contain a complete set of possible tables. All aggregated data is dropped into these tables once every 5 minutes. Site administrators configure Logger for each installed application so that the load is evenly distributed across all Logs databases. In this case, the information is not duplicated, that is, the same information can only get into one of the Logs databases.
Initially, we had one such base, but now we have several of them. The reason is as follows:
1) in each large hosting there should be one base of Logs so that in case of problems with hosting we do not lose all the statistics;
2) Logs bases no longer cope with the tasks as the collected data grows.
In parallel with the record in the Logs database, data is being downloaded from them into the DWH bases.
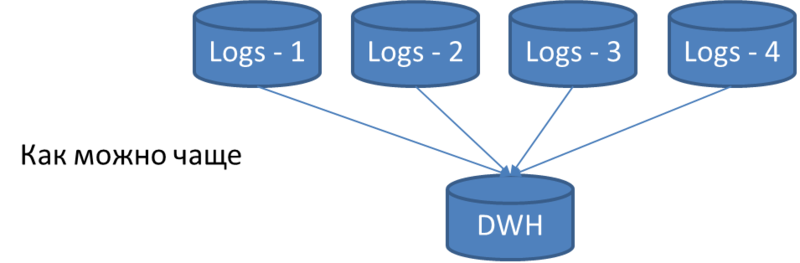
A DWH server in one thread polls each table in all Logs databases and downloads all new records that appeared after a previous download.
We calculate how fast the data should be uploaded to fit in 5 minutes. The number of polled tables is 300 * 4 = 1200. It turns out that, on average, 300/1200 = 0.25 seconds is allocated to one table. What to do if on average a table takes longer? To scale! We put another DWH server and unload half of the tables into one server, and the second half into the second server.

If there are more tables or data and again it’s impossible to keep within 2 minutes, then we put another DWH server, etc. Now we have 3 such DWH servers.
In the next article we will talk about how we built data loading in DWH servers, and what is spent on average 0.25 seconds per table.
Nature of the data
In the monitoring system, we collect data that is not tied to a specific user. We aggregate data by classifiers (one or several per table), which allows to significantly compress their total volume. At the same time, we practically lose nothing - information about the total activity of all users at a certain point in time is sufficient.
We also do not log the exact time of the event, but aggregate data by five minutes. It also allows you to significantly reduce the amount of data and create graphics, more "light" for perception and display in the browser.
')
Logger
Almost on each server of our site (and there are more than 4000 of them), in each application, the Logger library is used based on Log4j, which aggregates all the logs in asynchronous mode into tables, five-minutes and classifiers. Aggregation is carried out in memory, that is, work with the disk does not occur at all.
As a result of aggregation, we compress the data 1000 times - instead of 20 billion records in 5 minutes during rush hour we get only 20 million records. This, to put it mildly, is a very big difference.
Every five minutes, the Logger flushes the aggregated data to the intermediate data store, and then deletes it from memory. Moreover, it is necessary to reset these data in 2 minutes so that they reach the end user as quickly as possible and that there is a reserve of capacity (the maximum time allowed for data reset is 5 minutes, after which the data for the next five minutes will begin to reset).
Let's compare the two approaches. The average record length is 200 bytes.
1) Non-aggregated data
the amount of data per second - 20 000 000 000 (records) * 200 (bytes) / 120 seconds = 33 GB / sec
the amount of data per day - 2 000 000 000 000 (records) * 200 (bytes) = 400 TB / day
2) Aggregated data
the amount of data per second is 20,000,000 (records) * 200 (bytes) / 120 sec = 33 MB / sec
the amount of data per day - 2 000 000 000 (records) * 200 (bytes) = 400 GB / day
If we did not aggregate the data, then only for statistics we would need 33 GB * 8 = 264 Gb / s of network capacity.
With this approach, we use part of server resources (CPU and memory) to aggregate data, but since this part is very small, this does not really bother us.
Intermediate Data Warehouse: Evolution
If there were no intermediate storage, then the share of DWH servers would have 4000 parallel sessions that would write data at a speed of 33 MB per second. In parallel with this load, it would be impossible to do any data processing.
The task of intermediate data storage:
1) quickly save the data from 4000 Logger-applications;
2) quickly send fresh data to DWH-servers;
3) quickly delete old data after it is uploaded to DWH.
Although it sounds simple, we didn’t come right away to the architecture of the intermediate data warehouse that we have now and which suits us.
2008
In 2008, we did not have a DWH yet, but there were 300 servers that wrote their logs into one database with 20 tables. A separate application generated graphs, referring directly to the data in the same database. Each table had a clustered index by date and time to ensure fast reading over a specific period.
As the number of servers and the amount of data increased, graphics began to be generated more and more slowly. They could easily load the base so that it stopped accepting new records. Therefore, we decided to create a separate data warehouse that will download data from this database and efficiently serve queries from business analysis applications.
year 2009
Our new system was pumping data from the database of logs, which we began to call “intermediate storage”. The data structure was not changed, because it was necessary that the old graphics and Logger continued to work without changes.
Data for uploading we filtered by date and time. At the same time there was a lot of data with the same time, and they appeared asynchronously. It was necessary to unload data with a "large margin of safety." Therefore, we added a bigint ID column with auto-increment to each table and created an index on this column. After that, we could download one record only once.
It worked well for a while. The number of servers has grown to 700. And suddenly it turned out that the base of the logs is “not rubber” - the disk space ended. Old logs that were uploaded to DWH had to be deleted, but there was no effective way to do this. The DELETE command is impossible, because on large volumes it is too heavy and slow operation. I had to delete the records by re-creating the tables, which led to data loss and inaccessibility of the service.
2010
The number of servers and data volumes grew rapidly. Old logs in such an inefficient way had to be deleted more and more often. This turned into a real problem that had to be solved, and preferably in such a way that neither Logger nor DWH had to rewrite.
We could do this with the help of views and triggers.
For each table, an identical pair was created and renamed, adding the ending _1 and _2. Created a view with the same name as the original table. Servers write to this view. A trigger instead of insert was added to the view. It writes to the table with the end of _1 one week, and the second week - to the table with the end of _2.
Switching occurs in two stages. At first, only the trigger is switched, and the view itself reads data from the previous table. After DWH has downloaded all the data from the previous table to itself, the view is switched.
After that, the data from the old tables is effectively deleted by the truncate table command.
Thus, we got a solution that allowed deleting data without downtime and data loss, without requiring a change to the Logger.
Over time, the old charting system was no longer used, that is, there was no need for a clustered index by date and time. Therefore, we deleted it and made the index by ID cluster. Thanks to this, the system has become even more efficient.
2011
The number of servers has exceeded 3,000. The solution with views and triggers has become very load on the server's CPU with a fairly low disk queue. It was necessary to reduce the load, but the presence of triggers did not allow it. We decided that it was necessary to remake Logger, so that one week he would write in tables with _1, and the second - in _2. So did.
Part of the infrastructure was transferred to the new Logger. The load on the CPU has dropped, but the disk queue has grown to a critical level. The structure of the base is very simple - there is nothing to improve. We had to look for another solution.
year 2012
The disk queue was created by MS SQL Log Manager, working with the database log file. At that moment we had a MS SQL 2005 Standard Edition database. Experts argued that MS SQL 2008 Log Manager is an order of magnitude better than MS SQL 2005. We decided to check this and switched to MS SQL 2008 Enterprise Edition. Disk queue really dropped by an order!
At the same time, we decided to use partitioning tables to delete data. That is, they returned to the 2009 model, but only the cluster index by ID was divided into partitions of 20,000,000 records. After the partition is 100% full and all DWH servers have downloaded data, these partitions are deleted.
Partitions in SQL servers are “invisible” to developers, and this solution does not complicate the code. Deleting and adding partitions occurs online, no loss of connections and data.
The result is the following architecture:
Intermediate storage in the schema called Logs bases. All of them are identical in structure and contain a complete set of possible tables. All aggregated data is dropped into these tables once every 5 minutes. Site administrators configure Logger for each installed application so that the load is evenly distributed across all Logs databases. In this case, the information is not duplicated, that is, the same information can only get into one of the Logs databases.
Initially, we had one such base, but now we have several of them. The reason is as follows:
1) in each large hosting there should be one base of Logs so that in case of problems with hosting we do not lose all the statistics;
2) Logs bases no longer cope with the tasks as the collected data grows.
Downloading data from the intermediate data storage
In parallel with the record in the Logs database, data is being downloaded from them into the DWH bases.
A DWH server in one thread polls each table in all Logs databases and downloads all new records that appeared after a previous download.
We calculate how fast the data should be uploaded to fit in 5 minutes. The number of polled tables is 300 * 4 = 1200. It turns out that, on average, 300/1200 = 0.25 seconds is allocated to one table. What to do if on average a table takes longer? To scale! We put another DWH server and unload half of the tables into one server, and the second half into the second server.
If there are more tables or data and again it’s impossible to keep within 2 minutes, then we put another DWH server, etc. Now we have 3 such DWH servers.
In the next article
In the next article we will talk about how we built data loading in DWH servers, and what is spent on average 0.25 seconds per table.
Source: https://habr.com/ru/post/156199/
All Articles