Determining the dominant colors: Python and the k-means method
Assorium
Habré published several articles with algorithms and scripts to select the dominant colors in the image: 1 , 2 , 3 . In the comments to those articles you can find links to a dozen more similar programs and services. But there is no limit to perfection - and why not consider a method that seems the most optimal? We are talking about the use of clustering by the method of k-means (k-means).
Like many before him, American web developer Charles Leifer (Charles Leifer) used the k-means method to cluster the colors in an image. The idea of the method for clustering any data is to minimize the total quadratic deviation of cluster points from the centers of these clusters. At the first stage, the starting points (centers of mass) are chosen randomly and the membership of each element to one or another center is calculated. Then, at each iteration of the execution of the algorithm, the centers of mass are recalculated - until the algorithm converges.
The result is something like this. The points are colored, depending on the color of the cluster, the black dots represent the centers of mass.
')
As applied to images, each pixel is positioned in the three-dimensional RGB space, where the distance to the centers of mass is calculated. To optimize images are reduced to 200x200 using the library PIL . It is also used to extract RGB values.
Code
from collections import namedtuple from math import sqrt import random try: import Image except ImportError: from PIL import Image Point = namedtuple('Point', ('coords', 'n', 'ct')) Cluster = namedtuple('Cluster', ('points', 'center', 'n')) def get_points(img): points = [] w, h = img.size for count, color in img.getcolors(w * h): points.append(Point(color, 3, count)) return points rtoh = lambda rgb: '#%s' % ''.join(('%02x' % p for p in rgb)) def colorz(filename, n=3): img = Image.open(filename) img.thumbnail((200, 200)) w, h = img.size points = get_points(img) clusters = kmeans(points, n, 1) rgbs = [map(int, c.center.coords) for c in clusters] return map(rtoh, rgbs) def euclidean(p1, p2): return sqrt(sum([ (p1.coords[i] - p2.coords[i]) ** 2 for i in range(p1.n) ])) def calculate_center(points, n): vals = [0.0 for i in range(n)] plen = 0 for p in points: plen += p.ct for i in range(n): vals[i] += (p.coords[i] * p.ct) return Point([(v / plen) for v in vals], n, 1) def kmeans(points, k, min_diff): clusters = [Cluster([p], p, pn) for p in random.sample(points, k)] while 1: plists = [[] for i in range(k)] for p in points: smallest_distance = float('Inf') for i in range(k): distance = euclidean(p, clusters[i].center) if distance < smallest_distance: smallest_distance = distance idx = i plists[idx].append(p) diff = 0 for i in range(k): old = clusters[i] center = calculate_center(plists[i], old.n) new = Cluster(plists[i], center, old.n) clusters[i] = new diff = max(diff, euclidean(old.center, new.center)) if diff < min_diff: break return clusters Examples


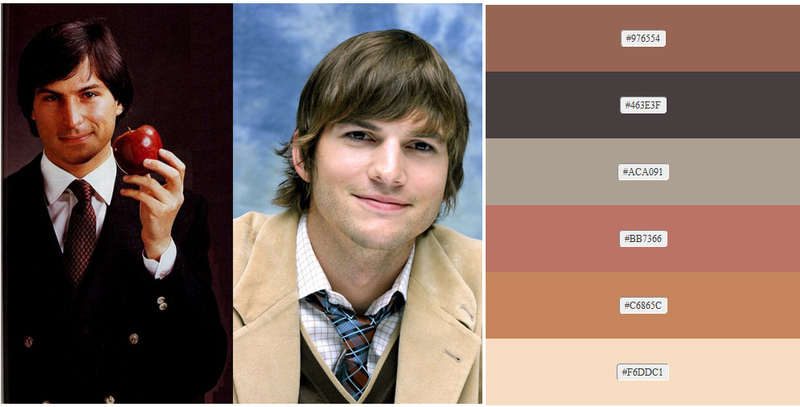
Determining the dominant colors is a rather useful thing that will always be used. This is the choice of a palette for a website or some elements of the UI. For example, the Chrome browser uses the k-means method to select the dominant color from the favicon.

Source: https://habr.com/ru/post/156045/
All Articles