We write our debugger for Windows [part 1]
Introduction
All of us, from time to time, use debugger for debugging programs. The debugger can be used with C ++, C #, Java and hundreds of other languages. It can be either external (WinDbg) or embedded in the development environment (Visual Studio). But have you ever wondered how the debugger works?
And you are lucky. In this series of articles we will understand from and to how debugging from the inside works. This article only covers writing a debugger under Windows. Without compilers, linkers and other complex systems. Thus, we can debug executable files only, as we write an external debugger. This article will require the reader to understand the basics of multithreading.
How to debug a program:
- Start the process with the flag DEBUG_ONLY_THIS_PROCESS or DEBUG_PROCESS;
- start a debug cycle that will catch messages and events;
Before we begin, remember:
- A debagger is a process / program that will debug another process;
- debugged program (OP) is a process / program that is being debugged;
- it is the debugger that joins the OP. Also otlachik can connect to different processes (in different threads);
- you can debug only those processes that were launched from under the debugger. Thus, CreateProcess and the debugger loop must be in the same thread;
- when the debugger process ends, it also terminates the OP;
- When the debugger is busy processing events, it freezes all the threads of the OD for a while. More on this later;
Running a process with a debug flag
We start the process using the CreateProcess function and in the sixth parameter (dwCreationFlags) we specify the flag DEBUG_ONLY_THIS_PROCESS. This flag tells Windows to prepare the process to be started for debugging (debugging events, process start / end, exceptions, etc.). A more detailed explanation later. Please note that we will use DEBUG_ONLY_THIS_PROCESS. This means that we want to debug only the process that we run, and not also generated by them.
STARTUPINFO si; PROCESS_INFORMATION pi; ZeroMemory( &si, sizeof(si) ); si.cb = sizeof(si); ZeroMemory( &pi, sizeof(pi) ); CreateProcess ( ProcessNameToDebug, NULL, NULL, NULL, FALSE, DEBUG_ONLY_THIS_PROCESS, NULL,NULL, &si, &pi ); After that, you should see the new process in the task manager, but in fact, it has not yet started. The newly created process is still frozen. No, they did not guess, we should not call ResumeThread, but write a debug loop.
Debug cycle
The debug loop is the heart of the debugger, and it is built around the WaitForDebugEvent function. It receives two parameters: a pointer to the DEBUG_EVENT structure and a timeout (DWORD). As a timeout, we specify INFINITE. This function is contained in kernel32.dll, so we do not need to link any additional libraries.
BOOL WaitForDebugEvent(DEBUG_EVENT* lpDebugEvent, DWORD dwMilliseconds); The DEBUG_EVENT structure includes a lot of debugging information: event code, process ID, flow ID, and application event information. As soon as the WaitForDebugEvent is completed and control returns, we will receive a debugger message, and then call ContinueDebugEvent to continue execution of the code. Below you can see the minimum debug cycle.
DEBUG_EVENT debug_event = {0}; for(;;) { if (!WaitForDebugEvent(&debug_event, INFINITE)) return; ProcessDebugEvent(&debug_event); // User-defined function, not API ContinueDebugEvent(debug_event.dwProcessId, debug_event.dwThreadId, DBG_CONTINUE); } Calling ContinueDebugEvent, we ask the OS to continue executing the OP. dwProcessId and dwThreadId point us to a process and thread. We got these values from WaitForDebugEvent. The last parameter indicates whether to continue or not. This parameter will have a value only when an exception has been received for debugging. This we will consider later. In the meantime, just use DBG_CONTINUE (another possible value is DBG_EXCEPTION_NOT_HANDLED).
Receiving debugging events
There are nine major debugging events, and 20 sub-events in the exception category. Consider this, starting with the simplest. Below is the DEBUG_EVENT structure:
struct DEBUG_EVENT { DWORD dwDebugEventCode; DWORD dwProcessId; DWORD dwThreadId; union { EXCEPTION_DEBUG_INFO Exception; CREATE_THREAD_DEBUG_INFO CreateThread; CREATE_PROCESS_DEBUG_INFO CreateProcessInfo; EXIT_THREAD_DEBUG_INFO ExitThread; EXIT_PROCESS_DEBUG_INFO ExitProcess; LOAD_DLL_DEBUG_INFO LoadDll; UNLOAD_DLL_DEBUG_INFO UnloadDll; OUTPUT_DEBUG_STRING_INFO DebugString; RIP_INFO RipInfo; } u; }; When the WaitForDebugEvent is successfully completed, it fills this structure. dwDebugEventCode indicates which debugging event has come to us. Depending on this code, one of the members of the union'a u contains information about the event. For example, if dwDebugEventCode == OUTPUT_DEBUG_STRING_EVENT, then only OUTPUT_DEBUG_STRING_INFO will correctly fill.
Processing OUTPUT_DEBUG_STRING_EVENT
To output text to output, developers usually use the OutputDebugString function. Depending on the language / framework you are using, you should be familiar with the TRACE / ATLTRACE macros. .NET developers may be familiar with System.Diagnostics.Debug.Print / System.Diagnostics.Trace.WriteLine. But all of these methods call OutputDebugString if the _DEBUG macro is declared, and the debugger receives the message.
When a debug message is received, we process the DebugString. The structure of OUTPUT_DEBUG_STRING_INFO is presented below:
struct OUTPUT_DEBUG_STRING_INFO { LPSTR lpDebugStringData; // char* WORD fUnicode; WORD nDebugStringLength; }; The nDebugStringLength field contains the length of the string, including the terminating null. The fUnicode field is zero if the string is ANSI, and non-zero if unicode. In this case, we need to read nDebugStringLength x2 bytes. Attention! lpDebugStringData contains a pointer to a message string, but the pointer refers to data on the memory of the program being debugged , not on the debugger.
To read data from the memory of another process, we need to call ReadProcessMemory and we must have permission to do so. Since we created the process for debugging, there are no problems with resolution.
case OUTPUT_DEBUG_STRING_EVENT: { CStringW strEventMessage; // Force Unicode OUTPUT_DEBUG_STRING_INFO & DebugString = debug_event.u.DebugString; WCHAR *msg=new WCHAR[DebugString.nDebugStringLength]; // Don't care if string is ANSI, and we allocate double... ReadProcessMemory(pi.hProcess, // HANDLE to Debuggee DebugString.lpDebugStringData, // Target process' valid pointer msg, // Copy to this address space DebugString.nDebugStringLength, NULL); if ( DebugString.fUnicode ) strEventMessage = msg; else strEventMessage = (char*)msg; // char* to CStringW (Unicode) conversion. delete []msg; // Utilize strEventMessage } What if the OP completes while reading the memory?
Well, this will not happen. Let me remind you that the debugger freezes all OD threads while debugging a message. Thus, the process itself will not be able to complete, No task manager (standard or not) will also be able to complete the process. If you try, in the next message, our debugger will receive the EXIT_PROCESS_DEBUG_EVENT event.
Processing CREATE_PROCESS_DEBUG_EVENT
The event appears when the OP starts up. This should be the first message the debugger receives. For this message, the corresponding DEBUG_EVENT field will be CreateProcessInfo. Below you can see the very structure of CREATE_PROCESS_DEBUG_INFO:
struct CREATE_PROCESS_DEBUG_INFO { HANDLE hFile; // The handle to the physical file (.EXE) HANDLE hProcess; // Handle to the process HANDLE hThread; // Handle to the main/initial thread of process LPVOID lpBaseOfImage; // base address of the executable image DWORD dwDebugInfoFileOffset; DWORD nDebugInfoSize; LPVOID lpThreadLocalBase; LPTHREAD_START_ROUTINE lpStartAddress; LPVOID lpImageName; // Pointer to first byte of image name (in Debuggee) WORD fUnicode; // If image name is Unicode. }; Please note that hProcess and hThread may differ from those we get in PROCESS_INFORMATION. The process ID and thread must be the same. Every handle you get from Windows is different. There are various reasons for this.
hFile, as well as lpImageName, can be used to get the name of the OP file. True, we already know the name of this file, because we launched it. But the location of the EXE or DLL is important for us to know, because when we receive a message LOAD_DLL_DEBUG_EVENT, it is good to know the name of the library.
As you can read in MSDN, lpImageName never contains the full file name and it will be stored in the memory of the OP. Moreover, there are no guarantees that the full file name will also be in the memory of the OP. And the file name may be incomplete. Therefore, we will get the file name from hFile.
How to get file name from hFile
Unfortunately, we will need to use the method described in MSDN , which contains about 10 function calls. Below is a shortened version:
case CREATE_PROCESS_DEBUG_EVENT: { CString strEventMessage = GetFileNameFromHandle(debug_event.u.CreateProcessInfo.hFile); // Use strEventMessage, and other members // of CreateProcessInfo to intimate the user of this event. } You may have noticed that I did not consider several fields of this structure. In the following parts we will look at it all thoroughly.
Processing LOAD_DLL_DEBUG_EVENT
This event is similar to CREATE_PROCESS_DEBUG_EVENT, and as you may have guessed, this event is triggered when the OS loads the DLL. This event is fired whenever a DLL is loaded, either explicitly or implicitly. Debug information contains only the time when the DLL was loaded, and its virtual address. To handle the event, we use the union'a LoadDll field. It has type LOAD_DLL_DEBUG_INFO
struct LOAD_DLL_DEBUG_INFO { HANDLE hFile; // Handle to the DLL physical file. LPVOID lpBaseOfDll; // The DLL Actual load address in process. DWORD dwDebugInfoFileOffset; DWORD nDebugInfoSize; LPVOID lpImageName; // These two member are same as CREATE_PROCESS_DEBUG_INFO WORD fUnicode; }; To get the file name, we will use the GetFileNameFromHandle function, the same as we used in CREATE_PROCESS_DEBUG_EVENT. I'll show this code when I talk about UNLOAD_DLL_DEBUG_EVENT. The UNLOAD_DLL_DEBUG_EVENT event does not contain complete information about the name of the DLL library.
Processing CREATE_THREAD_DEBUG_EVENT
This event is generated when the OP creates a new thread. Much like CREATE_PROCESS_DEBUG_EVENT, this event is created before a new thread is started. To get information about this event, we use the CreateThread field. The CREATE_THREAD_DEBUG_INFO structure is described below:
struct CREATE_THREAD_DEBUG_INFO { // Handle to the newly created thread in debuggee HANDLE hThread; LPVOID lpThreadLocalBase; // pointer to the starting address of the thread LPTHREAD_START_ROUTINE lpStartAddress; }; The thread ID is available in DEBUG_EVENT :: dwThreadId, so it's easy for us to display all the information about the thread:
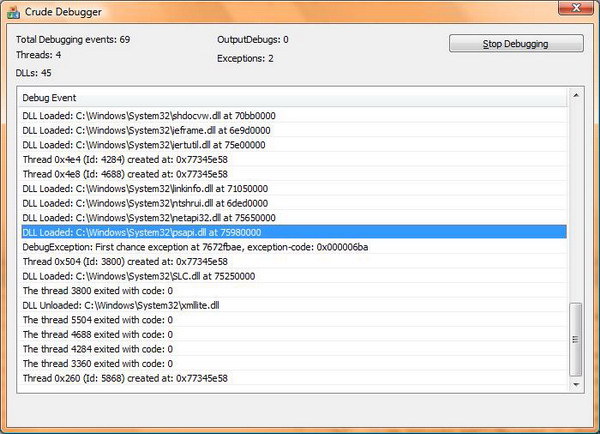
case CREATE_THREAD_DEBUG_EVENT: { CString strEventMessage; strEventMessage.Format(L"Thread 0x%x (Id: %d) created at: 0x%x", debug_event.u.CreateThread.hThread, debug_event.dwThreadId, debug_event.u.CreateThread.lpStartAddress); // Thread 0xc (Id: 7920) created at: 0x77b15e58 } lpStartAddress - the address of the beginning of the thread function relative to the OP, not the debugger We simply display it for completeness. Please note that this event is not generated when the main OP thread starts working, only when creating a new main thread.
Processing EXIT_THREAD_DEBUG_EVENT
This event is generated as soon as the child thread terminates and returns the return code to the system. The dwThreadId field in DEBUG_EVENT contains the ID of the terminating thread. To get the thread handle and other information from CREATE_THREAD_DEBUG_EVENT, we need to store this information in an array. To get information about this event, we use the ExitThread field, which is of type EXIT_THREAD_DEBUG_INFO:
struct EXIT_THREAD_DEBUG_INFO { DWORD dwExitCode; // The thread exit code of DEBUG_EVENT::dwThreadId }; Below is the event handler code:
case EXIT_THREAD_DEBUG_EVENT: { CString strEventMessage; strEventMessage.Format( _T("The thread %d exited with code: %d"), debug_event.dwThreadId, debug_event.u.ExitThread.dwExitCode); // The thread 2760 exited with code: 0 } Processing UNLOAD_DLL_DEBUG_EVENT
Of course, the event contains information and unloading DLL from the memory of the OP. But not everything is so simple! It is generated only if you call FreeLibrary, and not when the system itself unloads the library. For information, use UnloadDll (UNLOAD_DLL_DEBUG_INFO):
struct UNLOAD_DLL_DEBUG_INFO { LPVOID lpBaseOfDll; }; As you can see, only the base address of the library is available to us. That is why I did not immediately tell you about the code for LOAD_DLL_DEBUG_EVENT. While loading the DLL, we also get lpBaseOfDll. You can use the Map to store the name of the library, in addition to its address.
It is important to note that not all library load events will receive their unload event. However, we must store all library names, since LOAD_DLL_DEBUG_EVENT does not give us information about how the library was loaded.
Below is the code to handle both events:
std::map < LPVOID, CString > DllNameMap; ... case LOAD_DLL_DEBUG_EVENT: { strEventMessage = GetFileNameFromHandle(debug_event.u.LoadDll.hFile); // Storing the DLL name into map. Map's key is the Base-address DllNameMap.insert( std::make_pair( debug_event.u.LoadDll.lpBaseOfDll, strEventMessage) ); strEventMessage.AppendFormat(L" - Loaded at %x", debug_event.u.LoadDll.lpBaseOfDll); } break; ... case UNLOAD_DLL_DEBUG_EVENT: { strEventMessage.Format(L"DLL '%s' unloaded.", DllNameMap[debug_event.u.UnloadDll.lpBaseOfDll] ); // Get DLL name from map. } break; Processing EXIT_PROCESS_DEBUG_EVENT
This is one of the simplest events, and as you can guess, it is called when the OP process is completed. This event shows us how the process ended: normally or urgently (for example, through the task manager), or the program being debugged dropped. Information we get from EXIT_PROCESS_DEBUG_INFO ExitProcess;
struct EXIT_PROCESS_DEBUG_INFO { DWORD dwExitCode; }; As soon as we receive this event, we need to interrupt the debugging cycle and complete the debug flow. To do this, we can start a flag that will signal the completion of debugging.
bool bContinueDebugging=true; ... case EXIT_PROCESS_DEBUG_EVENT: { strEventMessage.Format(L"Process exited with code: 0x%x", debug_event.u.ExitProcess.dwExitCode); bContinueDebugging=false; } break; Processing EXCEPTION_DEBUG_EVENT
This is the most amazing and difficult thing in all debugging events. From MSDN:
This event is generated when an exception occurs in the process being debugged (possibly when dividing by zero, going beyond the array, executing an int 3 instruction, or any other exception described in SEH). The DEBUG_EVENT structure contains the EXCEPTION_DEBUF_INFO structure. It is she who describes the exception.
The description of the processing of this event requires a separate article to tell about it completely (yes, even if only partially). Therefore, I will tell you about one type of exception.
The Exception field contains information about the exception that has just occurred. Below you can see the description of the EXCEPTION_DEBUG_INFO structure:
struct EXCEPTION_DEBUG_INFO { EXCEPTION_RECORD ExceptionRecord; DWORD dwFirstChance; }; The ExceptionRecord field contains detailed information about the exception.
struct EXCEPTION_RECORD { DWORD ExceptionCode; DWORD ExceptionFlags; struct _EXCEPTION_RECORD *ExceptionRecord; PVOID ExceptionAddress; DWORD NumberParameters; ULONG_PTR ExceptionInformation[EXCEPTION_MAXIMUM_PARAMETERS]; // 15 }; Before we dive into EXCEPTION_RECORD, I would like to discuss EXCEPTION_DEBUG_INFO :: dwFirstChance with you.
When the process is under debugging, the debugger always gets an exception before the OP receives it. You must have seen the entry “First-chance exception at 0x00412882 in SomeModule” while debugging the application under C ++. This refers to First Chance exceptions. The same exceptions may or may not be on second chance exceptions.
When the OP throws an exception, it is treated as a second chance. The OP can handle this exception, or it can just fall. These exceptions do not belong to C ++ exceptions, but to the Windows SEH engine. I will reveal a little more in the next part of the article.
First, the debugger receives the first chance exception, which helps it handle the exception faster than the OP. Some libraries generate first-chance exceptions to help the debugger do its work.
More about ContinueDebugEvent
The third parameter of this function (dwContinueStatus) is important for us only to receive an exception. For other events, this parameter is ignored.
After receiving an exception, a ContinueDebugEvent should be called with:
- DBG_CONTINUE if the exception was successfully caught by the debugger. Nothing more is needed from the program being debugged and it can run normally.
- DBG_EXCEPTION_NOT_HANDLED if this exception is not handled (cannot be handled) by the debugger. The debugger can only record what the exception was.
Note that if DBG_CONTINUE is returned during a debugging event in which it cannot be returned, then the exact same exception will be thrown in the debugger, and the same event will come instantly. But since we are just starting to write a debugger, let's play with a safe slingshot, not a gun, and we will return EXCEPTION_NOT_HANDLED. The exception in this article is int 3 (breakpoint), which we will discuss later.
Exception Codes
- EXCEPTION_ACCESS_VIOLATION
- EXCEPTION_ARRAY_BOUNDS_EXCEEDED
- EXCEPTION_BREAKPOINT
- EXCEPTION_DATATYPE_MISALIGNMENT
- EXCEPTION_FLT_DENORMAL_OPERAND
- EXCEPTION_FLT_DIVIDE_BY_ZERO
- EXCEPTION_FLT_INEXACT_RESULT
- EXCEPTION_FLT_INVALID_OPERATION
- EXCEPTION_FLT_OVERFLOW
- EXCEPTION_FLT_STACK_CHECK
- EXCEPTION_FLT_UNDERFLOW
- EXCEPTION_ILLEGAL_INSTRUCTION
- EXCEPTION_IN_PAGE_ERROR
- EXCEPTION_INT_DIVIDE_BY_ZERO
- EXCEPTION_INT_OVERFLOW
- EXCEPTION_INVALID_DISPOSITION
- EXCEPTION_NONCONTINUABLE_EXCEPTION
- EXCEPTION_PRIV_INSTRUCTION
- EXCEPTION_SINGLE_STEP
- EXCEPTION_STACK_OVERFLOW
Calm down, I'm not going to describe them all. EXCEPTION_BREAKPOINT only:
case EXCEPTION_DEBUG_EVENT: { EXCEPTION_DEBUG_INFO& exception = debug_event.u.Exception; switch( exception.ExceptionRecord.ExceptionCode) { case STATUS_BREAKPOINT: // Same value as EXCEPTION_BREAKPOINT strEventMessage= "Break point"; break; default: if(exception.dwFirstChance == 1) { strEventMessage.Format(L"First chance exception at %x, exception-code: 0x%08x", exception.ExceptionRecord.ExceptionAddress, exception.ExceptionRecord.ExceptionCode); } dwContinueStatus = DBG_EXCEPTION_NOT_HANDLED; } break; } You should know what a breakpoint is. Outside of the standard point of view, a breakpoint can be called using the DebugBreak API, or using the assembler instruction {int 3}. In .NET, you can create it using System.Diagnostics.Debugger.Break. The debugger will receive a STATUS_BREAKPOINT code (the same as EXCEPTION_BREAKPOINT). The debugger usually uses this event to stop the current process, and can show the source code of the place where the event occurred. But since our debugger is just beginning to be developed, we will show the user only basic information without the source code.
If the breakpoint is called in an application that is not under the debugger, it will simply fall. You can use the following design:
if ( !IsDebuggerPresent() ) AfxMessageBox(L"No debugger is attached currently."); else DebugBreak(); In conclusion, I would like to give the simplest debugging event: EXCEPTION_DEBUG_EVENT. This event will come all the time. Debuggers like Visual Studio ignore it, but WinDbg does not.
Conclusion
Use any debugger for debugme.

The second part will be even more interesting and it is on the way!
UPD: Part 2
')
Source: https://habr.com/ru/post/154847/
All Articles