PRTG: Monitoring system and some useful tips

There are a huge number of monitoring systems on the market, ranging from the most simple and free to expensive solutions from well-known manufacturers such as Hewlett-Packard and Microsoft.
In this article I will tell you about the system PRTG Network Monitor from the company Paessler AG . I just want to make a reservation that I am not a serious IT specialist, but I work in the field of security, although I work closely enough with the departments of IT and IT Security.
')
The choice of software was made by me on the basis of the surface analysis of manufacturers' sites.
Introduction: Why PRTG?
In June 2011, I was given a fairly simple task - it was necessary to monitor the work of computers of security officers and employees of my department in all offices of the organization on the following points:
• Is the computer turned on?
• Have you entered into the computer at least one domain account?
• Is a corporate anti-virus installed on the PC?
• Have the anti-virus databases been updated?
And it was necessary to automate the release of reports from the monitoring system, to provide management on a weekly basis.
It was necessary to do this independently without the intervention of IT staff and without resorting to their help.
I had absolutely no experience in the field of monitoring at that time and I had to analyze for a few days what Google and Yandex offered me. In the search results, I found PRTG, which was offered absolutely free, but with a limit on the number of sensors that can be installed.
This option suited me perfectly, as if necessary, there was money to buy the commercial version. I understood that 10 sensors would not be enough for me even to demonstrate the capabilities of the system to management, and I bought the cheapest paid version (the price list below is presented in June 2011 - now the prices are higher), which includes 100 sensors:


It was after this that my acquaintance with the system began.
General system functionality
The system over the past almost a year and a half of my acquaintance has improved significantly with it (builds come out consistently once a month, and sometimes more often). I will try to describe its capabilities in as much detail as possible, as well as talk about some interesting things that I learned to do in this software.
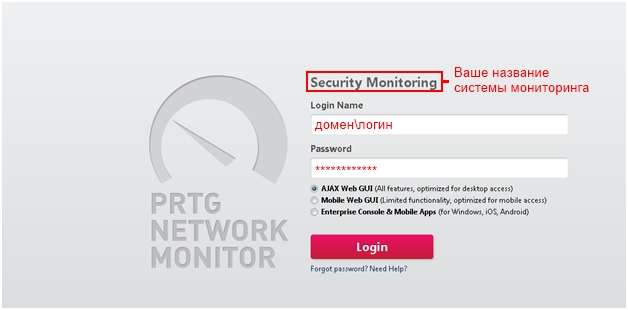
(Fig. 1 - Login Screen)
In this case, logging into the system through a web interface is shown. If you are not accustomed to using the browser to work with the system, you can use applications for your mobile devices (currently only for Android) or install the Enterprise Console on the PC, which repeats the interface almost 100% through the Web.
As I have already shown in the screenshot above, the system supports domain account authorization, but you can also create a UZ manually if you have such a desire.
Immediately after entering you will be taken to the welcome screen:

(Fig. 2 - Welcome screen)
If this is your first login to the system, after installation, then I recommend to follow the Run Configuration Guru link, which will help you set up most of the initial configs immediately:
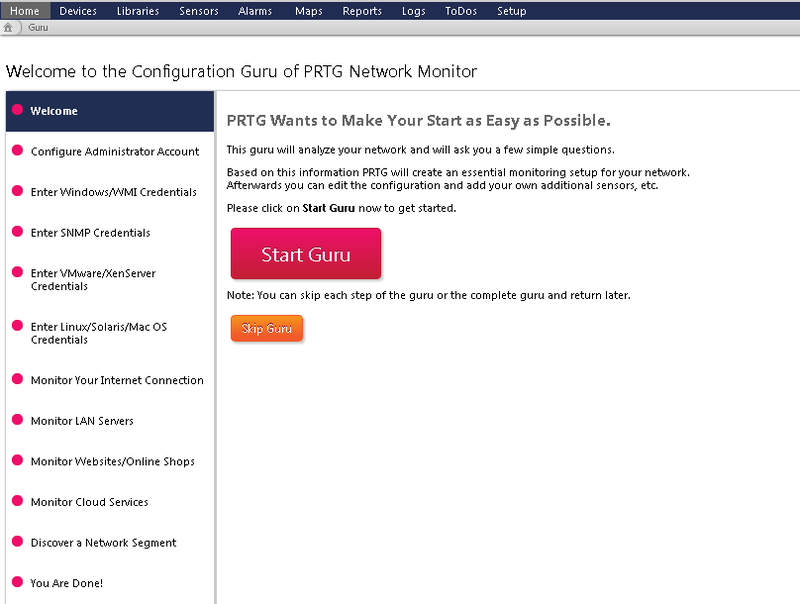
(Fig. 3 - Configuration Guru)
This is where you configure:
• Username and password of your root administrator account (core admin)
• Data for use with WMI sensors (usually an account that has administrative authority in the domain)
• If you are using a UNIX or LINUX system, you can also register the data of your UZ.
• Data for connecting to the Internet (for example, if a proxy server is used in your organization) - access to the Internet is at least useful because you can activate the system without sending codes to paessler’s mail, but directly, but of course With a stable Internet connection, the system itself will be able to download and install updates.
• Find your PC, server, and other peripheral equipment in automatic mode (if the network or network segment is small and several hundred machines will not be searched).
After the basic setup, you will be taken to a page where all your devices and sensors are displayed:

(Fig. 4 — Device Home Page)
Indicators of different colors mean the following:
Red - error \ not available \ exceeding the specified parameter \ fault to the specified parameter
Orange - atypical sensor behavior (Example: Ping is currently 200 ms, with an average ping on this device at this time of the day / week 110 ms)
Yellow - a warning (the sensor is approaching the critical limits of a given parameter or has become unavailable at the time of the last test)
Green - normal sensor behavior
Blue - pause (set either manually or automatically). During a pause, the sensor can be set by both the administrator and the system itself for several reasons: the main sensor for the device is not available and all other sensors of the device are set to pause mode; too many requests at the same time - the sensor will be restarted after receiving data from other sensors.
Gray - no data received from the sensor (only turned on, only the pause mode has ended)
Hint: As I wrote above, pause mode can be automatically stamped. In my installation of the system, the following logic is registered in each device - if the ping sensor (main on each device) is not available, then all other sensors on the device automatically go into pause mode in order not to send in vain requests (the device is most likely unavailable).

(Fig. 5 - Behavior of the device when the main sensor is paused)
Next, we consider a typical solution (created as a template) that I use for newly added computers:
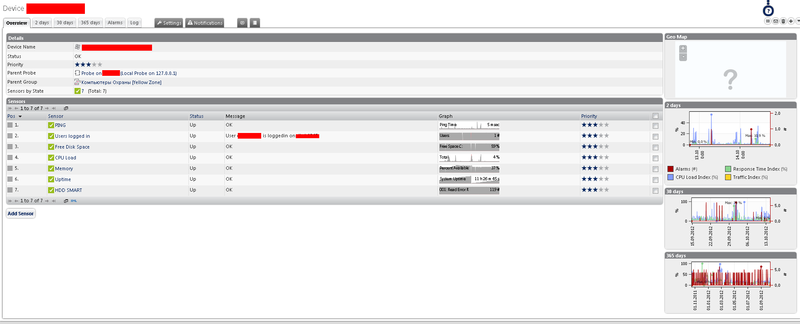
(Fig. 6 - Typical PC)
Ping - standard ping to the car. The main sensor on the device.
Users logged in - who logged in to this particular machine.
Free Disk Space -% free hard disk space.
CPU Load -% of CPU load (s).
Memory -% of memory usage.
Uptime - time since the last restart of the PC. A manual warning is set — over 14 days — to notify the administrator.
HDD Smart - checks several parameters for reading / writing a hard disk.
If we talk about the presentation of devices, then there are 2 options:
1.) Already presented above option for grouping sensors inside devices.
2.) Map mode - you yourself draw / model a map of the location of your devices for more convenient visual perception.
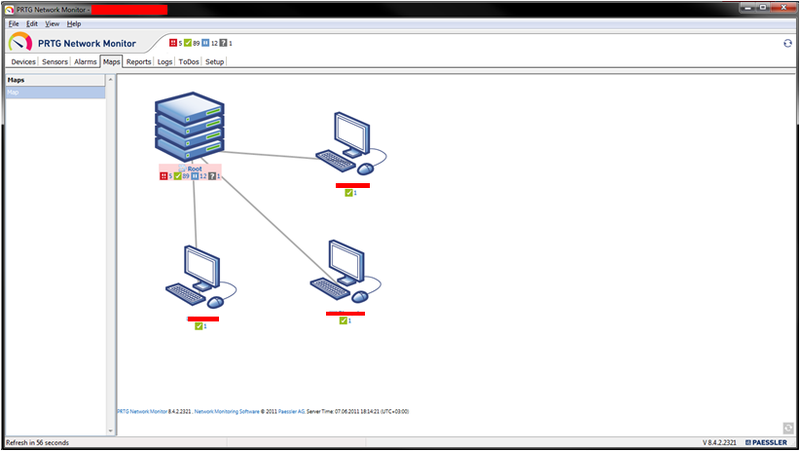
(Fig. 7 - Map)
At this point, I’ll finish showing the basic functionality of the system, and we’ll move on to what sensors can be configured in the system and what interesting solutions I have already been able to design.
A bit about sensors
Currently, over 130 different sensors are available in the system. More details about each of them can be found on the page Description of Sensors .
Sensors are divided into the following conditional categories:
• Common Sensors
• Bandwidth Monitoring Sensors
• Web Servers (HTTP) Sensors
• SNMP Sensors
• Windows / WMI Sensors
• Linux / Unix / OS X Sensors
• Virtual Servers Sensors
• Mail Servers Sensors
• SQL Database Servers Sensors
• File Servers Sensors
• Various Servers Sensors
• VoIP and QoS Sensors
• Hardware Parameter Sensors
• Custom Sensors
The menu for adding sensors since version 11 of the software has become extremely convenient and understandable:
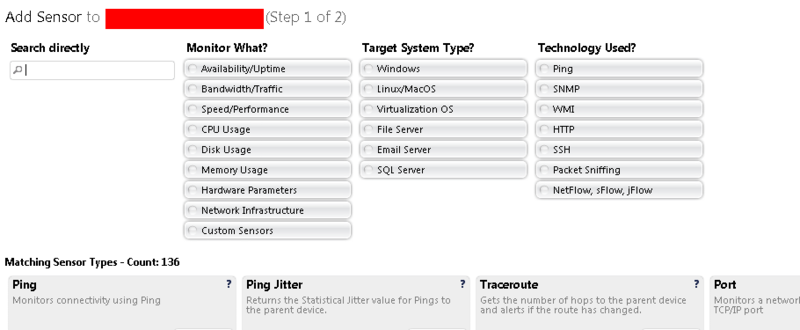
(Fig. 8 - Adding a new sensor)
You can either select a category, and then select the desired sensor, or search for a sensor in the list below, or enter a part of the name and select a sensor from the already sorted list.
I use less than half of the sensor types offered by the developer, but this is enough for me to keep the servers and PCs entrusted to me under full control and to be sure that everything is working properly.
Reading the basic description of the sensors would be quite boring, so I would prefer to describe some interesting examples from my experience with the system.
Wait! Who goes?
The first successful example was the search for violators. In this particular case, we consider as a violator any user who is not the “owner” of a particular PC.
To search for the intruder, we will use 2 sensors of the type Users logged in . The first sensor will show us the real picture - who is currently logged on to the machine (and whether it is logged in at all), and the second sensor will have a filter on itself with the logins of authorized employees (that is, these logins will not be reflected).
On the second sensor, we set an alert - if the number of users is greater than 0 (and we remember that the logins we need will simply not be displayed), then immediately notify the administrator by mail. You will receive the login of the violator in the letter along with the name and IP address of the machine where the employee tried to enter.
Very effective if you really need to evaluate who came to the PC quickly enough.
IT assistant
In our organization, 100% of remote employee assistance is provided through DMWare. To track remote inputs on a PC, I installed a process sensor that monitors the DMWare Mini Remote Control process and as soon as the process begins to take more than 10 MB of memory, it issues an alert with the name \ IP of the machine. Regularly in my case, the process takes 6-7 MB, and in working condition (when someone uses remote input) about 20 MB. So far, for half a year of using this trick, there has not been 1 failure \ false positive.
The third useful example has already been described by me - it is a pause of all sensors after a non-response from the ping sensor.
In addition, I set up sms alerts if any of the servers (ping server) is unavailable for more than 10 minutes. Configured on the resource bulksms. The only negative - the names should be exclusively in Latin, otherwise in the SMS you will get that you have an inaccessible server ??????.
Important: If you have not found a sensor that meets your requirements, this is not a reason to abandon the system - you have the opportunity to manually load the scripts \ write the sensor. This makes the system even more customized.
At the end of this chapter, I note that the touch functionality is really very rich and can perform many different actions - it's up to you. The above are just examples of how I currently use the system, and perhaps inspired by these examples, you will want to see if this system is better than what you are currently using.
Reports
At the moment, in my installation, 4 reports have been automatically generated: weekly reports on Moscow PCs and PCs in the regions, as well as their monthly counterparts.
At the manual start, reports on the availability of servers and specific processes / services on these servers are installed.
As an example, I will show the menu of the monthly regional report:
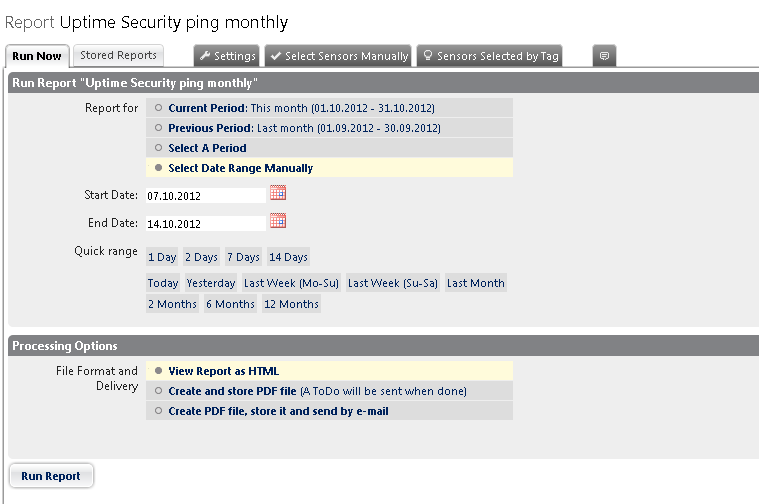
(Fig. 9 - Report)
Despite the fact that the report is set to automatic, you have the ability to manually start the process.
As you can see from the screenshot, you have 3 report release options: view the report page online in html mode, save the report as a PDF file on the server and notify you when the report is completed by mail or send the PDF file itself to the end user.
On the Stored Reports tab you will find all the files saved on your server.
If you save the report to PDF, it will look something like this:
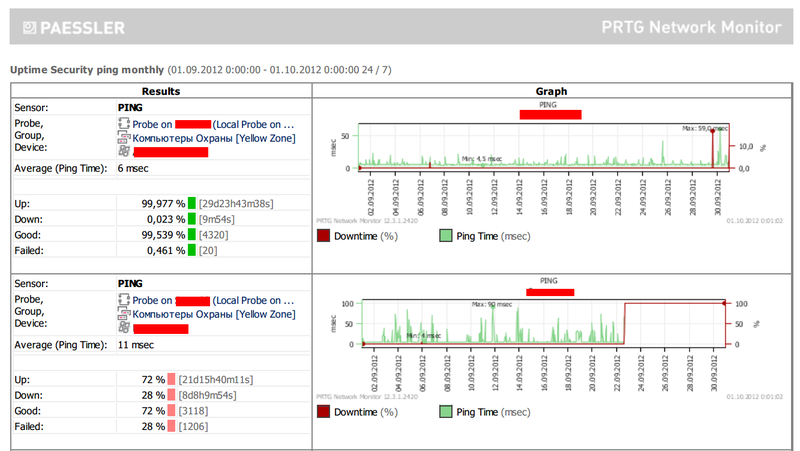
(Fig. 10 - PDF Report)
In this case, used a graphical representation of the data. If you are interested in specifics, then you can generate reports in text form in a section, for example, 5 minutes. Then you will receive instead of a picture a line like:
01/01/2012 09:00:00 - 01/01/2012 09:05:00 Ping 100% Available
Most of the reports you just set up 1 time, test it with the user who will use it and forget. The format of the presentation in my case was very much liked even by those who are afraid of the computer as fire and usually resort with questions like " I entered the password 10 times incorrectly, and for some reason the computer was blocked "
Logs
The logging system in this software product is absolutely there and it logs absolutely everything, starting from the behavior of the sensors and ending with the formation of reports and sending SMS messages.

(Fig. 11 - Log example)
Those who like to delve into the details of this tab will certainly be useful, and even more so it is visually pleasing, since the log is colored in different colors depending on the criticality and the type of event.
Conclusion
At the moment, me and my employee completed 3 phases of system improvement. With each phase, we add and find more and more features and tricks in the settings. Back in August last year, when I installed the system I bought after the presentation to the management, I didn’t suspect that I could bring it to the state in which it is at the moment.
The process of improving the monitoring system can last for years and will not be brought to perfection anyway. In this review, I tried to show the most relevant things in my opinion that I found in this software product, as well as some of the tricks that I already use at the moment.
I hope after reading this article at least a few people will find for themselves something interesting, and possibly very necessary in their work.
List of useful sites on the subject
• Developer site - Paessler AG
• Additional sensors, addons and programs for PRTG
Source: https://habr.com/ru/post/154747/
All Articles