Monitoring of switches Cisco, D-Link, 3Com, Zyxel in the Zabbix system
Monitoring is one of the pillars for ensuring high availability of IT systems.
As a rule, during the installation of the monitoring system, system administrators first of all configure it to check the server parameters and detect the unavailability of services running on these servers. Of course this is a priority task, but do not forget about other equipment: UPS, air conditioning systems, network equipment.
In this topic, I will show how to solve the task of monitoring active network equipment (ie switches, routers, etc.) in the Zabbix system in half an hour using a couple of useful tools. As a result, you can get a complete picture of what is happening on the network.
')
I think I will not be mistaken if I say that most system administrators have to work with the inherited "zoo" of equipment of various models and vendors. Fortunately, most models support the open SNMP protocol. It is for him that we will receive information about the status of network interfaces.
Suppose you have Zabbix installed. To use SNMP you need:
Taking into account the fact that each network port can have several monitored parameters, a typical switch has 24 or even 48 ports, and there can be dozens of switches on the network, manual configuration is too time consuming.
To facilitate the task it is necessary to use templates. The template contains all the necessary items, triggers and graphics - all that remains is to get a host and connect a template to it.
For Zabbix, there are already many ready-made templates that you can either google or view in the manual .
If you did not find the desired template, do not worry: as a rule, manufacturers use standard OIDs from RFC1213 and RFC2233:
In addition, you can read the interface name, MTU, speed and other parameters. See the full list on the Cisco website .
Cisco Catalyst typically support additionally:
.1.3.6.1.4.1.9.9.109.1.1.1.1.1.1 - the percentage of CPU load
.1.3.6.1.4.1.9.9.48.1.1.1.5.1 - occupied memory (in bytes)
.1.3.6.1.4.1.9.5.1.2.13.0 - temperature status (1 - normal, 2 - increased, 3 - critical)
Noticing that the identifiers are standardized, I wrote a simple PHP script that allows you to generate an XML template for Zabbix with the required OID for all ports. We tested it on Cisco hardware (500G, 2960. 3550 and 3750), 3Com (2426, 2924, 2948), a pair of D-Link and Zyxel 4012. (Who wants, can download the source ).
The generator creates templates that can:
After you have generated and saved the template for the device, unzip it: go to Configuration → Templates and click the Import button in the upper right. Create a new Host or edit an existing one - attach your template to it.
If you want to change any parameters (for example, the SNMP community), this can be done directly in Zabbix: go to the template in Configuration → Templates , in Items select the necessary items with a checkmark and select Mass update from the drop-down list.
As a result, you get nice graphics:
If several minutes have passed after the template has been added to the device, and the data from SNMP has not yet appeared, it is necessary to check whether the Zabbix server can read data from the device. This is done by the snmpget utility:
For example, we get the number of bytes sent on the first gigabit port for Cisco:
For non-Cisco hardware:
If you receive a
The message
To read the full list of parameters from the device run:
GUI lovers can use the MIB Browser to read SNMP data from the device.
The map will have to be carefully compiled by hand. Here you need to know a couple of tricks. To show the speed above the connecting lines between the equipment, add a call to the signature of the corresponding item in curly brackets. For example:
The entry 02-CS-42-3750: ifOutOctets.10112.last (0) means to receive from the host 02-CS-42-3750 the last time value of the ifOutOctets parameter (bytes sent).
Also in the Link properties you can adjust the display of the line in red if the port drops to down.
Unfortunately, Zabbix does not have a convenient tool for viewing the status of individual device ports, so I had to write it. Information is imported from Zabbix and displayed to the administrator in a convenient form:
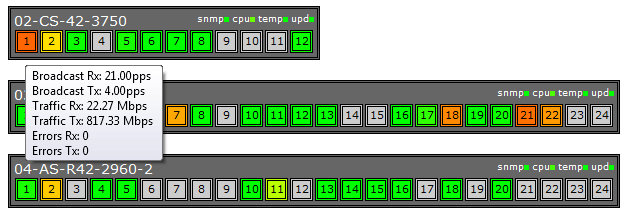
The gray color of the port indicates that it is in down. The color from green to red varies depending on the port load. Gigabit ports are framed.
The minus of the script is that it was written “for itself”, so the installation is rather clumsy (-:. Download the source code and read the readme. UPD 13.03.13 ( Zabbix version 2.0 )
Not to mention a possible performance problem with a zabbix server. Suppose that once a minute you receive information about 11 parameters of each port of 50 24-port switches. The zabbix server database will have an average load of 220 entries per second. For a weak car, it can be overwhelming. Therefore, it is recommended to limit the number of items or increase the inspection interval. We consider it sufficient to request the status of the port, traffic, the number of errors and broadcast packets every 60 seconds.
In the next version of the template generator, I would like to add the ability to obtain the remaining interface parameters, the choice of line colors for graphics, the ability to specify the port speed for non-Cisco devices. Suggestions are welcome.
As a rule, during the installation of the monitoring system, system administrators first of all configure it to check the server parameters and detect the unavailability of services running on these servers. Of course this is a priority task, but do not forget about other equipment: UPS, air conditioning systems, network equipment.
In this topic, I will show how to solve the task of monitoring active network equipment (ie switches, routers, etc.) in the Zabbix system in half an hour using a couple of useful tools. As a result, you can get a complete picture of what is happening on the network.
')
We include monitoring
I think I will not be mistaken if I say that most system administrators have to work with the inherited "zoo" of equipment of various models and vendors. Fortunately, most models support the open SNMP protocol. It is for him that we will receive information about the status of network interfaces.
Suppose you have Zabbix installed. To use SNMP you need:
- enable SNMP support on the network device (commands depend on manufacturer)
- add the corresponding item in Zabbix - one for each parameter; to do this, you must specify the version of SNMP used, the correct identifier of the SNMP OID parameter and the SNMP community (something like the user name)
- add triggers to track unwanted item values
Taking into account the fact that each network port can have several monitored parameters, a typical switch has 24 or even 48 ports, and there can be dozens of switches on the network, manual configuration is too time consuming.
To facilitate the task it is necessary to use templates. The template contains all the necessary items, triggers and graphics - all that remains is to get a host and connect a template to it.
For Zabbix, there are already many ready-made templates that you can either google or view in the manual .
If you did not find the desired template, do not worry: as a rule, manufacturers use standard OIDs from RFC1213 and RFC2233:
| sysName.0 | node name | |
| .1.3.6.1.2.1.1.3.0 | uptime | |
| .1.3.6.1.2.1.2.2.1.8.X | port status: 1 (up) / 2 (down) | X is the port number; Cisco has a five-digit port number: 100XX for 100 Mbps ports 101XX for 1 Gbps |
| .1.3.6.1.2.1.2.2.1.16.X | sent bytes | |
| .1.3.6.1.2.1.2.2.1.10.X | accepted bytes | |
| .1.3.6.1.2.1.31.1.1.1.5.X | sent broadcast packages | |
| .1.3.6.1.2.1.31.1.1.1.3.X | accepted broadcast packages | |
| .1.3.6.1.2.1.31.1.1.1.4.X | sent multicast packets | |
| .1.3.6.1.2.1.31.1.1.1.2.X | accepted multicast packets | |
| .1.3.6.1.2.1.2.2.1.17.X | unicast packages sent | |
| .1.3.6.1.2.1.2.2.1.11.X | unicast packages accepted | |
| .1.3.6.1.2.1.2.2.1.20.X | errors when sending | |
| .1.3.6.1.2.1.2.2.1.14.X | errors upon receipt |
Cisco Catalyst typically support additionally:
.1.3.6.1.4.1.9.9.109.1.1.1.1.1.1 - the percentage of CPU load
.1.3.6.1.4.1.9.9.48.1.1.1.5.1 - occupied memory (in bytes)
.1.3.6.1.4.1.9.5.1.2.13.0 - temperature status (1 - normal, 2 - increased, 3 - critical)
Pattern Generator
Noticing that the identifiers are standardized, I wrote a simple PHP script that allows you to generate an XML template for Zabbix with the required OID for all ports. We tested it on Cisco hardware (500G, 2960. 3550 and 3750), 3Com (2426, 2924, 2948), a pair of D-Link and Zyxel 4012. (Who wants, can download the source ).
The generator creates templates that can:
- monitor interface parameters (see table above) and display them on a graph;
- set the trigger to drop the port;
- set a trigger for speeding up the error increment at the port;
- Track CPU, memory, and temperature for Cisco.
After you have generated and saved the template for the device, unzip it: go to Configuration → Templates and click the Import button in the upper right. Create a new Host or edit an existing one - attach your template to it.
If you want to change any parameters (for example, the SNMP community), this can be done directly in Zabbix: go to the template in Configuration → Templates , in Items select the necessary items with a checkmark and select Mass update from the drop-down list.
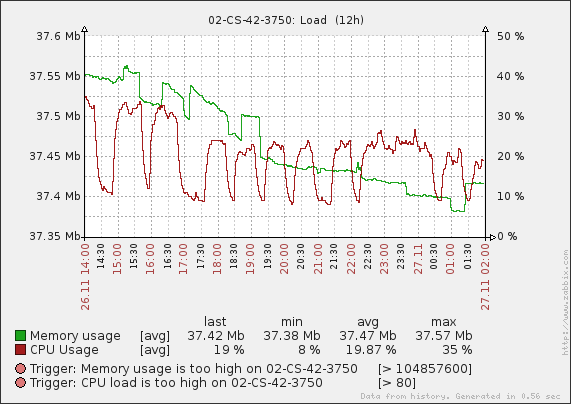
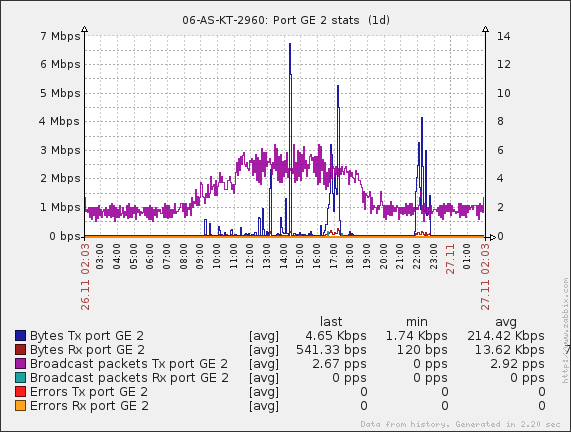
As a result, you get nice graphics:
Debugging
If several minutes have passed after the template has been added to the device, and the data from SNMP has not yet appeared, it is necessary to check whether the Zabbix server can read data from the device. This is done by the snmpget utility:
snmpget -v _ -c _ OIDFor example, we get the number of bytes sent on the first gigabit port for Cisco:
snmpget -v 2c -c qwerty 192.168.1.1 .1.3.6.1.2.1.2.2.1.16.10101IF-MIB::ifOutOctets.10101 = Counter32: 2044250092For non-Cisco hardware:
snmpget -v 2c -c qwerty 192.168.1.2 .1.3.6.1.2.1.2.2.1.16.1IF-MIB::ifOutOctets.1 = Counter32: 1691279168If you receive a
Timeout: No Response from ... message, then you need to make sure that SNMP is enabled on the device and the server is allowed to connect to port 161 / UDP of the switch.The message
No Such Object available on this agent at this OID indicates that the requested parameter is not supported.To read the full list of parameters from the device run:
snmpwalk -v _ -c _GUI lovers can use the MIB Browser to read SNMP data from the device.
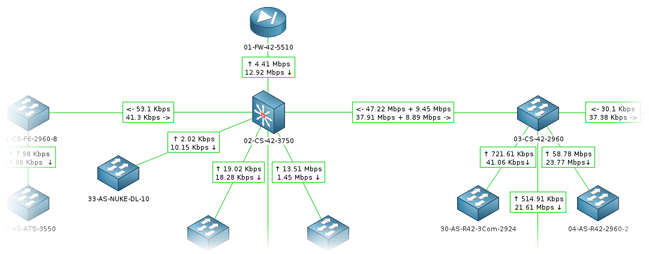
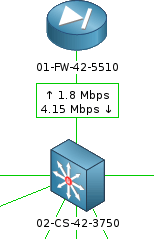
Network map
The map will have to be carefully compiled by hand. Here you need to know a couple of tricks. To show the speed above the connecting lines between the equipment, add a call to the signature of the corresponding item in curly brackets. For example:
↑ {02-CS-42-3750:ifOutOctets.10112.last(0)}{02-CS-42-3750:ifInOctets.10112.last(0)} ↓The entry 02-CS-42-3750: ifOutOctets.10112.last (0) means to receive from the host 02-CS-42-3750 the last time value of the ifOutOctets parameter (bytes sent).
↑ and ↓ These are just arrow codes ↑ and ↓ for beauty.Also in the Link properties you can adjust the display of the line in red if the port drops to down.
Port State Monitoring
Unfortunately, Zabbix does not have a convenient tool for viewing the status of individual device ports, so I had to write it. Information is imported from Zabbix and displayed to the administrator in a convenient form:
The gray color of the port indicates that it is in down. The color from green to red varies depending on the port load. Gigabit ports are framed.
The minus of the script is that it was written “for itself”, so the installation is rather clumsy (-:. Download the source code and read the readme. UPD 13.03.13 ( Zabbix version 2.0 )
Performance
Not to mention a possible performance problem with a zabbix server. Suppose that once a minute you receive information about 11 parameters of each port of 50 24-port switches. The zabbix server database will have an average load of 220 entries per second. For a weak car, it can be overwhelming. Therefore, it is recommended to limit the number of items or increase the inspection interval. We consider it sufficient to request the status of the port, traffic, the number of errors and broadcast packets every 60 seconds.
Plans
In the next version of the template generator, I would like to add the ability to obtain the remaining interface parameters, the choice of line colors for graphics, the ability to specify the port speed for non-Cisco devices. Suggestions are welcome.
Source: https://habr.com/ru/post/154723/
All Articles