Visualization of the characteristic function
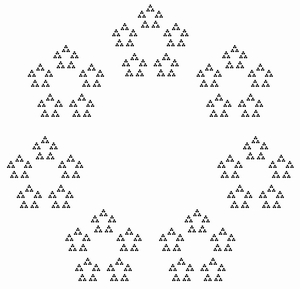 Many have a general idea of how backward ray tracing works: every pixel in the output window, the algorithm passes a ray and calculates with which scene objects it intersects and how the pixel should be illuminated as a result. The algorithm essentially requires that we have a function that for each position returns the color of the point. Of course, the same approach can be used not only for three-dimensional graphics: any image can be rasterized in this way, if we have a suitable function. Let us consider, for example, how to use this approach to solve the problem of visualizing prime factorization diagrams , which helarqjsc wrote about .
My implementation is here . The picture shows 10! = 3628800, although all the details, of course, is not visible.
In this problem, as in many others, the color is binarized: either black or white. Accordingly, we need a function of the form function check (x, y), which returns a Boolean value, telling us whether to fill the given point. Mathematicians would say that check (x, y) is the characteristic function of a set of points on a plane (in mathematics, such a function usually returns 1 or 0). If this function is set, the HTML5 Canvas drawing algorithm will be quite simple:
function trace(canvas) { var ctx = canvas.getContext("2d"); var w = canvas.width; var h = canvas.height; var img = ctx.createImageData(w, h); for(var x=0; x<w; x++) for(var y=0; y<h; y++) if(check(x,y)) img.data[(y*w+x)*4+3]=255; ctx.putImageData(img, 0, 0); } Here we use the fact that createImageData creates a black transparent canvas. We only change the byte responsible for transparency.
Suppose we want to depict, for example, a circle with a center (50, 50) and a radius of 50. The function check (x, y) will look like this:
function check(x,y) { return (x-50)*(x-50)+(y-50)*(y-50)<50*50; } The sum of the squares of distances from the center is less than the square of the radius. We get this picture:
Of course, for a circle it is easier and cheaper to use the library function. In addition, our circle turned out angular. To fight this a bit, let's use subpixel rendering: divide the pixel into n × n smaller ones, run the check for each of them and set the transparency in proportion to the number of successful checks:
function trace(canvas) { var ctx = canvas.getContext("2d"); var w = canvas.width; var h = canvas.height; var img = ctx.createImageData(w, h); var n = 2; for(var x=0; x<w; x++) for(var y=0; y<h; y++) { var k=0; for(var xx=0; xx<n; xx++) for(var yy=0; yy<n; yy++) if(check(x+xx/n, y+yy/n)) k++; if(k) img.data[(y*w+x)*4+3]=255*k/n/n; } ctx.putImageData(img, 0, 0); } The result is:

Already quite beautiful. To whom a little, you can increase the value of n (of course, it will be slower to count).
')
Let's return to the initial task. As a matter of fact, we need to write a characteristic function for a number factorization diagram for prime factors. I will slightly change the prototype of the function in order to transfer all the necessary parameters of the task and use recursion. The check function will take arguments (factors, n, x, y, r), where x and y are the coordinates of a point relative to the center of the circle, r is the radius of the circle, factors are an array of simple factors, where the twos are already combined into fours, as did helarqjsc , and n is the element of the array with which we need to begin the examination. Then the check function will look something like this:
 - If the distance from the center to the current point is greater than the radius, the point does not exactly fit - return false;
- If n indicates the end of the array, then we have reached the end and we just need to draw a filled circle - we will return true;
- Otherwise, we calculate the radius of the circle of the following order (r1);
- If the distance from the center to the current point is less than the radius minus the diameter of the new circle (2 * r1), then the point falls inside the ring - return false;
- Calculate the sector in which the point falls (in gray in the picture);
- Let us call ourselves with the same factors, by a unit large n, new radius r1 and x and y values, corrected in accordance with the center of the new circle.
That's all. You can see the finished JS application here (support for canvas in the browser is required, no fallback for IE 6-8 is present). I used the helarqjsc functions to factor into simple factors, and the rendering is completely mine. I have slightly different pictures, because I calculated the radii of the circles and the arrangement of the sectors differently. You may notice that the drawing speed is almost independent of the number entered. Although the implementation of helarqjsc is faster for the first hundred, but then mine starts to win (for honesty, I also did not cache the values of sines and cosines). The approach I used allows us to simplify and speed up the visualization of many non-trivial things. It is especially useful when rendering fractals. Notice also that with my approach it is very easy to add an unlimited zoom in any area of the picture.
Source: https://habr.com/ru/post/154343/
All Articles