Clustering in the Rambler-Maps API
We will continue our acquaintance with the Rambler-Kart API , and this time we will deal with the clustering of labels .
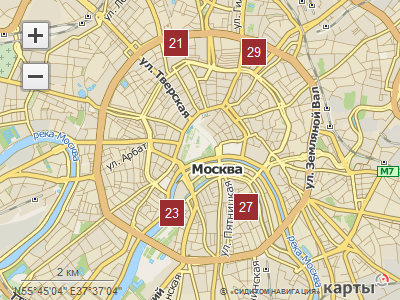
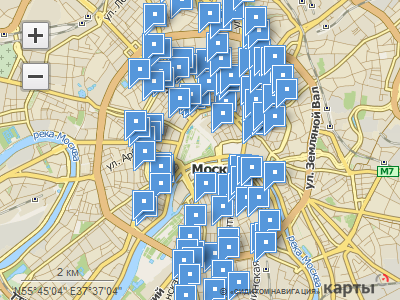
When too many marks are concentrated on one part of the map, they overlap each other, closing large parts of the map. It is difficult to find and choose among them. And in general, it does not look too neat.
You can deal with this problem with the help of the makeCluster method, which clusters labels and leaves only cluster labels on the map, which indicate the number of merged points.
')
For example, consider the labels of Moscow pharmacies on the map before clustering and after.
To create a set of tags, use the geocoding method search with the search query "pharmacy". According to the coordinates taken from the results found, we will construct labels (we will construct them solely for the sake of clarity of the “before-and-after” example - generally speaking, an array of coordinates is enough to create a cluster, you will see this later).
Now it's up to you. The array of labels found pharmacies divided into clusters.
The source code of the example is available at the link: maps.rambler.ru/api/examples/TutorialClusterize.html
A few words about the clustering algorithm. We use Quadtree : the map at the smallest scale (zoom level = 1) is divided into 4 squares, each of which is assigned a number: 0, 1, 2, 3. At the next zoom level, each of these squares is again divided into 4 squares. 16 new squares are numbered according to belonging to large: 00, 01, 02, 03, 10, 11, ..., 44. The operation of dividing squares into 4 smaller ones repeats to some level of scaling n, on which, respectively, will be 4 ^ n squares, each of which has a unique n-digit number.
Knowing the number of the square, you can determine where it is on the map and on what scale. Labels appearing on one such square form a cluster.
Passing the parameter maxZoom in the arguments of the method, we indicate on what scale it is necessary to stop merging the labels into clusters and start showing them separately (that is, each in its place). In fact, maxZoom is the above mentioned number n.
When too many marks are concentrated on one part of the map, they overlap each other, closing large parts of the map. It is difficult to find and choose among them. And in general, it does not look too neat.
You can deal with this problem with the help of the makeCluster method, which clusters labels and leaves only cluster labels on the map, which indicate the number of merged points.
')
For example, consider the labels of Moscow pharmacies on the map before clustering and after.
To create a set of tags, use the geocoding method search with the search query "pharmacy". According to the coordinates taken from the results found, we will construct labels (we will construct them solely for the sake of clarity of the “before-and-after” example - generally speaking, an array of coordinates is enough to create a cluster, you will see this later).
var pharmacies = map.search("", function(err, data, transport){ // var coordArray = []; // var markerArray = []; // var items = data.res[0].matches // for ( var i=0, item; item=items[i]; i++){ // coordArray[i] = { lon: item.x, lat: item.y }; // markerArray[i] = map.geometry.create("marker", { coord: coordArray[i] }) } Now it's up to you. The array of labels found pharmacies divided into clusters.
// ( markerArray, ) var cl = map.makeCluster(coordArray, { area: "cell", // // CSS, , clusterMarker: { "class": "", offsets: {x: -.5, y: -.5}, html: '<div style= "background:#9B2D30; border:1px solid #FFF; color:#FFF; padding:5px; ">${quantity}</div>' } }); console.log(cl); }); Is done
The source code of the example is available at the link: maps.rambler.ru/api/examples/TutorialClusterize.html
PS
A few words about the clustering algorithm. We use Quadtree : the map at the smallest scale (zoom level = 1) is divided into 4 squares, each of which is assigned a number: 0, 1, 2, 3. At the next zoom level, each of these squares is again divided into 4 squares. 16 new squares are numbered according to belonging to large: 00, 01, 02, 03, 10, 11, ..., 44. The operation of dividing squares into 4 smaller ones repeats to some level of scaling n, on which, respectively, will be 4 ^ n squares, each of which has a unique n-digit number.
Knowing the number of the square, you can determine where it is on the map and on what scale. Labels appearing on one such square form a cluster.
Passing the parameter maxZoom in the arguments of the method, we indicate on what scale it is necessary to stop merging the labels into clusters and start showing them separately (that is, each in its place). In fact, maxZoom is the above mentioned number n.
Source: https://habr.com/ru/post/154009/
All Articles