TypeScript debugging
Most recently, Microsoft introduced TypeScript as a superset of JavaScript.
The language seemed interesting to me, but there was one thing ... but the question was how to debug it.
Since writing in a powerful and convenient language is one thing, but maintaining and correcting errors in logic is another. And in this case, the debugger can not do. That is what stopped me from using CoffeScript or ScriptSharp and the like.
But just yesterday, I learned about SourceMap (better to learn late than not to know at all). And it was like light at the end of the tunnel for me.
And the main thing is that now in the TypeScript compiler there is support for SourceMap.
To try debugging in action, create an HTML Application with TypeScript project.
In my case, the directory with the project is C: \ projects \ TypeScriptHTMLApp1
')
Now you need to compile the app.ts file with the -sourcemap option
C: \ projects \ TypeScriptHTMLApp1> tsc -sourcemap app.ts
As a result, the file will appear on the disk app.js.map
And in the app.js file there will be a link to app.js.map
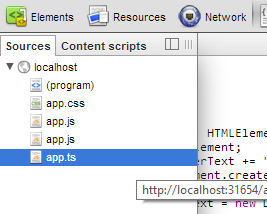
Now you can run our website in Google Chrome, with the Enable Source Maps option enabled.
Here you can see that our * .ts file is uploaded.
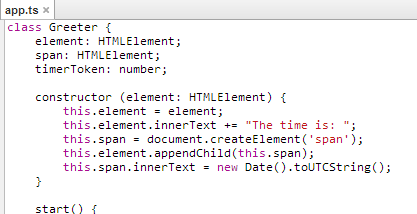
Here is the source code
And here is the actual breakpoint in the TypeScript file
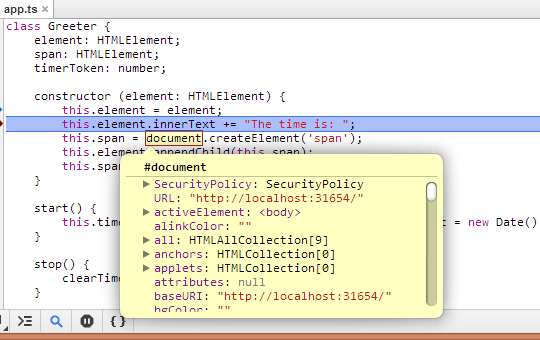
It also shows that we can view variables, etc.
This article is not a translation, but I took the idea here:
Using Source Maps with TypeScript
The language seemed interesting to me, but there was one thing ... but the question was how to debug it.
Since writing in a powerful and convenient language is one thing, but maintaining and correcting errors in logic is another. And in this case, the debugger can not do. That is what stopped me from using CoffeScript or ScriptSharp and the like.
But just yesterday, I learned about SourceMap (better to learn late than not to know at all). And it was like light at the end of the tunnel for me.
And the main thing is that now in the TypeScript compiler there is support for SourceMap.
To try debugging in action, create an HTML Application with TypeScript project.
In my case, the directory with the project is C: \ projects \ TypeScriptHTMLApp1
')
Now you need to compile the app.ts file with the -sourcemap option
C: \ projects \ TypeScriptHTMLApp1> tsc -sourcemap app.ts
As a result, the file will appear on the disk app.js.map
And in the app.js file there will be a link to app.js.map
Now you can run our website in Google Chrome, with the Enable Source Maps option enabled.
Here you can see that our * .ts file is uploaded.
Here is the source code
And here is the actual breakpoint in the TypeScript file
It also shows that we can view variables, etc.
This article is not a translation, but I took the idea here:
Using Source Maps with TypeScript
Source: https://habr.com/ru/post/153803/
All Articles