Writing image map editor (html image map) on javascript / html5 / inline SVG
Image maps are used when you want to create a link to a form other than a rectangular one. For example, for presentation sites, display plans / schemes, etc.
Previously, it was convenient to create such maps in Adobe ImageReady, but since the CS3 version, this program no longer comes with Photoshop. Today, there is similar functionality in Adobe Fireworks, but installing this program only because of the map editor (I only need Photoshop for work) is not a good idea. There are also online editors that are mostly written using canvas. They do not have the ability to edit the created areas on the map. If you make a mistake, you will have to redo everything. Yes, and create these areas is not very convenient. Another disadvantage is that the image must be uploaded to the server. In general, it is necessary to write something of their own.
So, the task:
- write on javascript an editor that allows you to create image maps - upload a picture, draw areas, we get html-code. If you make a mistake, it should be possible to edit the map. The editor should work in offline mode. Provide support for modern browsers only, including Internet Explorer 9.
')
Instead of canvas, svg is perfect for visually displaying the drawn map areas. Changing the size and coordinates of the created or edited area can be tracked by changing the attributes of the corresponding svg-elements. To use the features of the DOM , you need to embed the svg element on the page (not through img,object, see UPD, embed).
UPD For svg embedded on the page via object, you can also work with the DOM, but this is a bit less convenient.
An example is in the article http://habrahabr.ru/post/127994/ .
(thanks torbasow )
Fortunately, html5 has the ability to embed inline svg ( supported in modern browsers , including IE 9+). For xhtml, it is also possible to embed svg, you just have to remember about the
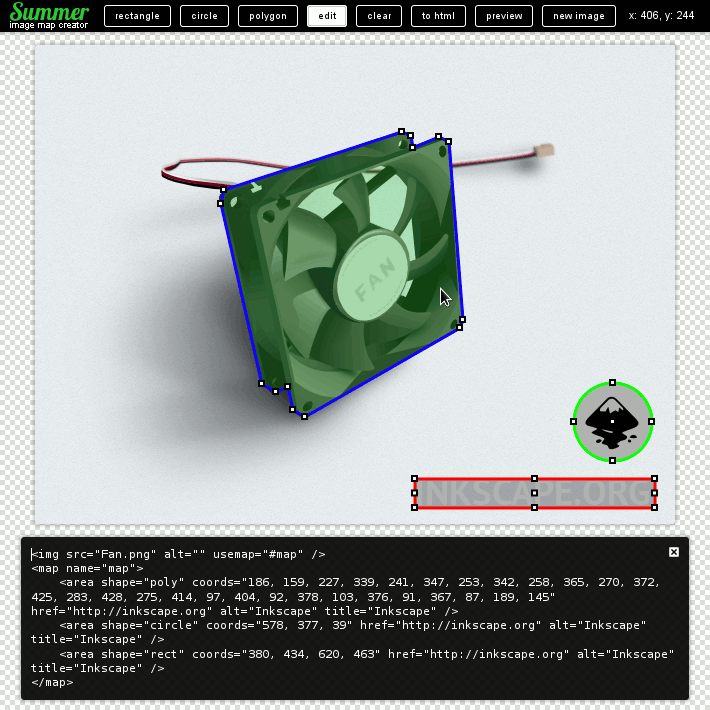
For image maps, there are 3 possible types of areas - rectangle, circle, and polygon. Analogs of these forms in svg are the elements rect, circle, polygon (at the polyline drawing stage):

For each region, auxiliary points are also needed - helper points (small rectangles 5x5) - to indicate the key nodes of the region and the point-by-point capability to edit this region.
For a rectangle, it will be 9 points - 4 at the vertices, 4 in the middle of each side and one in the center. For a circle - 5 (one in the center and 4 on the circle). For a polygon, by the number of vertices.
To make it easier to delete the region together with the helpers, we will combine them into groups - in the svg-element
For the helpers, we also specify the cursor property depending on the class (in editing mode this will be a hint as to what type of editing will be used when clicking on this helper).
Styles for SVG elements will be placed together with the styles for the page - in main.css.
First you need to "download" into the editor the image for which you want to create a map. The easiest way is to specify the path to this image. This method is convenient if the picture is on any website, then you just need to copy its path. But if the picture is stored on your computer, then it is not very convenient. It would be good to choose a picture, for example, with the help of
The editor has 3 main modes:
The remaining buttons:
I borrowed a lot of ideas from the vector editor Inkscape , in which I often draw. By the way, Inkscape uses the SVG format to save images, and Adobe Illustrator also knows how to save a drawing in SVG.
Image Map Editor (Summer html image map creator)
Github
F1 - display help
F5 - reload the page and re-display the form to load the image
ENTER - to finish drawing a polygon (or click on the first helper)
ESC - cancel creating a new area
SHIFT - draw a square in the case of a rectangle or a line at a right angle in the case of a polygon
DELETE - delete the selected area.
ESC - cancel editing the selected area.
SHIFT - when editing, keep the proportions of the rectangle
i - edit attributes (href, title, alt) of the selected area (or double click on the area)
- move selected area up
↓ - move the selected area down
← - move the selected area to the left
→ - move the selected area to the right
Previously, it was convenient to create such maps in Adobe ImageReady, but since the CS3 version, this program no longer comes with Photoshop. Today, there is similar functionality in Adobe Fireworks, but installing this program only because of the map editor (I only need Photoshop for work) is not a good idea. There are also online editors that are mostly written using canvas. They do not have the ability to edit the created areas on the map. If you make a mistake, you will have to redo everything. Yes, and create these areas is not very convenient. Another disadvantage is that the image must be uploaded to the server. In general, it is necessary to write something of their own.
So, the task:
- write on javascript an editor that allows you to create image maps - upload a picture, draw areas, we get html-code. If you make a mistake, it should be possible to edit the map. The editor should work in offline mode. Provide support for modern browsers only, including Internet Explorer 9.
')
SVG is great here
Instead of canvas, svg is perfect for visually displaying the drawn map areas. Changing the size and coordinates of the created or edited area can be tracked by changing the attributes of the corresponding svg-elements. To use the features of the DOM , you need to embed the svg element on the page (not through img,
UPD For svg embedded on the page via object, you can also work with the DOM, but this is a bit less convenient.
<object type="image/svg+xml" data="pucture.svg" id="picture"></object> var svgobject = document.getElementById('picture'), svgdom = svgobject.contentDocument; An example is in the article http://habrahabr.ru/post/127994/ .
(thanks torbasow )
Fortunately, html5 has the ability to embed inline svg ( supported in modern browsers , including IE 9+). For xhtml, it is also possible to embed svg, you just have to remember about the
Content-Type: application/xhtml+xml header, which is not very convenient.Types of areas
For image maps, there are 3 possible types of areas - rectangle, circle, and polygon. Analogs of these forms in svg are the elements rect, circle, polygon (at the polyline drawing stage):
Rectangle
html
<area shape="rect" coords="50, 20, 150, 70" /> svg
<rect x="50" y="20" width="100" height="50"/> A circle
html
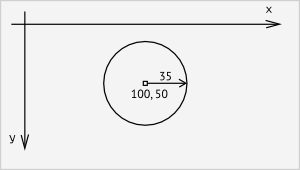
<area shape="circle" coords="100, 50, 35" /> svg
<circle cx="100" cy="50" r="35"/> Polygon
html
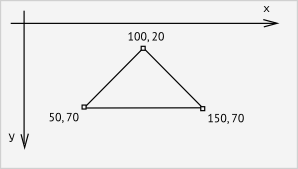
<area shape="poly" coords="100, 20, 150, 70, 50, 70" /> svg
<polyline points="100 20 150 70 50 70" /> <polygon points="100 20 150 70 50 70" /> For each region, auxiliary points are also needed - helper points (small rectangles 5x5) - to indicate the key nodes of the region and the point-by-point capability to edit this region.
For a rectangle, it will be 9 points - 4 at the vertices, 4 in the middle of each side and one in the center. For a circle - 5 (one in the center and 4 on the circle). For a polygon, by the number of vertices.
To make it easier to delete the region together with the helpers, we will combine them into groups - in the svg-element
.

SVG-
SVG- rect, circle, polygon CSS.
stroke ( , ), fill , ( / / / href / href). , RGBA, - . .

#svg rect { stroke-width: 3px; stroke: #F00; fill: rgba(255,255,255,0.3); } #svg rect.with_href { fill: rgba(0,0,0,0.3); } .edit#svg rect:hover { fill: rgba(50,200,50,0.3); } #svg rect.active { fill: rgba(0,0,0,0.5); } #svg circle { stroke-width: 3px; stroke: #0F0; fill: rgba(255,255,255,0.3); } #svg circle.with_href { fill: rgba(0,0,0,0.3); } .edit#svg circle:hover { fill: rgba(50,200,50,0.3); } #svg polyline, #svg polygon { stroke-width: 3px; stroke: #00F; fill: rgba(255,255,255,0.3); } #svg polygon.with_href { fill: rgba(0,0,0,0.3); } .edit#svg polygon:hover { fill: rgba(50,200,50,0.3); } #svg .selected { fill: rgba(50,200,50,0.5) !important; } #svg rect.helper { fill: #FFF; stroke: #000; stroke-width: 2px; } #svg rect.helper:hover { fill: #F00; }
.
SVG-
SVG- rect, circle, polygon CSS.
stroke ( , ), fill , ( / / / href / href). , RGBA, - . .
#svg rect { stroke-width: 3px; stroke: #F00; fill: rgba(255,255,255,0.3); } #svg rect.with_href { fill: rgba(0,0,0,0.3); } .edit#svg rect:hover { fill: rgba(50,200,50,0.3); } #svg rect.active { fill: rgba(0,0,0,0.5); } #svg circle { stroke-width: 3px; stroke: #0F0; fill: rgba(255,255,255,0.3); } #svg circle.with_href { fill: rgba(0,0,0,0.3); } .edit#svg circle:hover { fill: rgba(50,200,50,0.3); } #svg polyline, #svg polygon { stroke-width: 3px; stroke: #00F; fill: rgba(255,255,255,0.3); } #svg polygon.with_href { fill: rgba(0,0,0,0.3); } .edit#svg polygon:hover { fill: rgba(50,200,50,0.3); } #svg .selected { fill: rgba(50,200,50,0.5) !important; } #svg rect.helper { fill: #FFF; stroke: #000; stroke-width: 2px; } #svg rect.helper:hover { fill: #F00; } .
SVG-
SVG- rect, circle, polygon CSS.
stroke ( , ), fill , ( / / / href / href). , RGBA, - . .
#svg rect { stroke-width: 3px; stroke: #F00; fill: rgba(255,255,255,0.3); } #svg rect.with_href { fill: rgba(0,0,0,0.3); } .edit#svg rect:hover { fill: rgba(50,200,50,0.3); } #svg rect.active { fill: rgba(0,0,0,0.5); } #svg circle { stroke-width: 3px; stroke: #0F0; fill: rgba(255,255,255,0.3); } #svg circle.with_href { fill: rgba(0,0,0,0.3); } .edit#svg circle:hover { fill: rgba(50,200,50,0.3); } #svg polyline, #svg polygon { stroke-width: 3px; stroke: #00F; fill: rgba(255,255,255,0.3); } #svg polygon.with_href { fill: rgba(0,0,0,0.3); } .edit#svg polygon:hover { fill: rgba(50,200,50,0.3); } #svg .selected { fill: rgba(50,200,50,0.5) !important; } #svg rect.helper { fill: #FFF; stroke: #000; stroke-width: 2px; } #svg rect.helper:hover { fill: #F00; }
.
SVG-
SVG- rect, circle, polygon CSS.
stroke ( , ), fill , ( / / / href / href). , RGBA, - . .
#svg rect { stroke-width: 3px; stroke: #F00; fill: rgba(255,255,255,0.3); } #svg rect.with_href { fill: rgba(0,0,0,0.3); } .edit#svg rect:hover { fill: rgba(50,200,50,0.3); } #svg rect.active { fill: rgba(0,0,0,0.5); } #svg circle { stroke-width: 3px; stroke: #0F0; fill: rgba(255,255,255,0.3); } #svg circle.with_href { fill: rgba(0,0,0,0.3); } .edit#svg circle:hover { fill: rgba(50,200,50,0.3); } #svg polyline, #svg polygon { stroke-width: 3px; stroke: #00F; fill: rgba(255,255,255,0.3); } #svg polygon.with_href { fill: rgba(0,0,0,0.3); } .edit#svg polygon:hover { fill: rgba(50,200,50,0.3); } #svg .selected { fill: rgba(50,200,50,0.5) !important; } #svg rect.helper { fill: #FFF; stroke: #000; stroke-width: 2px; } #svg rect.helper:hover { fill: #F00; } For the helpers, we also specify the cursor property depending on the class (in editing mode this will be a hint as to what type of editing will be used when clicking on this helper).
.edit#svg rect, .edit#svg circle, .edit#svg polygon { cursor: move; } .edit#svg .pointer { cursor: pointer; } .edit#svg .e-resize { cursor: e-resize; } .edit#svg .ne-resize { cursor: ne-resize; } .edit#svg .nw-resize { cursor: nw-resize; } .edit#svg .n-resize { cursor: n-resize; } .edit#svg .se-resize { cursor: se-resize; } .edit#svg .sw-resize { cursor: sw-resize; } .edit#svg .s-resize { cursor: s-resize; } .edit#svg .w-resize { cursor: w-resize; } Styles for SVG elements will be placed together with the styles for the page - in main.css.
Interface
First you need to "download" into the editor the image for which you want to create a map. The easiest way is to specify the path to this image. This method is convenient if the picture is on any website, then you just need to copy its path. But if the picture is stored on your computer, then it is not very convenient. It would be good to choose a picture, for example, with the help of
/> , that is, by means of the explorer. But in this case, in a number of browsers, you can access only the name of the selected file, but not the full path (due to security policy). And here HTML5 Drag and drop and File api come to the rescue (not supported in IE9, for which only the first method will remain). Drag the picture, using FileReader, read its contents and get its base64 option . Everything, now the necessary picture is displayed in the editor. Now you can draw a map.The editor has 3 main modes:
- drawing mode ( rectangle , circle , polygon buttons) - first click on the field - the drawing of the corresponding object begins. The second click - the drawing area for the rectangle and the circle is completed. In the case of a polygon, the figure closes when you click on the first helper or by pressing ENTER;
- edit mode ( edit button) - allows you to move, delete selected areas (by pressing DELETE), edit their parameters using helper points and add href, title, alt attributes (by double clicking on the area);
- view mode ( preview button) - hides the svg and displays the generated image map. Clicking on a region leads to the corresponding link (if href was added to the region).
The remaining buttons:
- clear - clear the field (delete all areas drawn);
- to html - generate and display the html-code of the map;
- new image - clear the field and return to the image selection for the map.
I borrowed a lot of ideas from the vector editor Inkscape , in which I often draw. By the way, Inkscape uses the SVG format to save images, and Adobe Illustrator also knows how to save a drawing in SVG.
What happened in the end
Image Map Editor (Summer html image map creator)
Github
Hotkeys:
F1 - display help
Image loading:
F5 - reload the page and re-display the form to load the image
Drawing mode (rectangle, circle, polygon)
ENTER - to finish drawing a polygon (or click on the first helper)
ESC - cancel creating a new area
SHIFT - draw a square in the case of a rectangle or a line at a right angle in the case of a polygon
Edit mode
DELETE - delete the selected area.
ESC - cancel editing the selected area.
SHIFT - when editing, keep the proportions of the rectangle
i - edit attributes (href, title, alt) of the selected area (or double click on the area)
- move selected area up
↓ - move the selected area down
← - move the selected area to the left
→ - move the selected area to the right
Source: https://habr.com/ru/post/152731/
All Articles