From serial to parallel code in five steps with Intel® Advisor XE
If you have been developing multi-threaded applications for a long time, you have probably come across the parallelization of already existing sequential code. Or vice versa, you are new to parallel programming, and you are faced with the task of optimizing the project and improving scalability, which can also be solved by parallelizing individual sections of the program.
The new Intel Advisor XE tool will help you parallelize the application, spending at least a minimum of time and effort.
Advisor XE was released in September this year as part of the package for developers Intel Parallel Studio XE 2013 . The literal translation of the name - "adviser" - quite succinctly describes its purpose. The tool helps the programmer to analyze the possibility of code parallelization: to find the most suitable sections for this and evaluate the intended useful effect - is it worth it to do this at all? In addition, Advisor XE will tell you where errors may occur, such as data races. And all this without a real modification of the program! But first things first.
Advisor XE is available for Windows * and Linux * and works with C ++, C #, and Fortran. In this post, I will use the Windows * version - it has easy integration into Microsoft Visual Studio * (for those who want, there is also its own interface without integration). As an example, I took the Tachyon program included in the Advisor XE example set. It performs 2D rendering and ray tracing, producing the following image:
')

In Visual Studio Advisor XE adds its own toolbar, which provides quick access to its functions. So, open your project, build it in the “Release” mode and open the “Advisor XE Workflow”:

Advisor XE Workflow guides the developer through the five steps of evaluating the application, after which he will be able to make a sensible decision on whether to parallelize this code and where to do it.
Stage 1. Profiling (Survey Target)
The first thing Advisor XE does is launch your application and profile it, i.e. evaluates performance and searches for “hot spots” —functions, loops, and individual instructions that consume most of the processor resources. This is necessary in order to concentrate efforts on the most critical for the performance areas, since their parallelization will bring the greatest effect. To begin profiling, click the “Collect Survey Data” button in the Advisor XE Workflow window:

Advisor XE runs the application, waits until it is finished, and “finalizes” the collected data. After that, the user is presented with a list of functions and places in the code in a hierarchical form, for each of which the CPU time is displayed in seconds and percentages. Separately shown is the intrinsic time of the function and the time including the nested functions:

Those places where the “hot spot” is a cycle are marked with a special icon. This is convenient because Loops often become the object of parallelization if, for example, they process large amounts of independent data.
The profiling data gives the programmer a first estimate of the load distribution within the application. This allows you to make a meaningful, digit-based assumption about which parts of the code will be useful to parallelize.
In our example, we will stop the selection at the topmost in the stack of calls of the function containing the cycle - parallel_thread. It (including nested functions) accounts for 80.9% of the CPU time spent. By the way, double clicking on the “hot” function will take you to the source view, where there will also be information about using the CPU, but for specific lines of code.
Stage 2. Annotations (Annotate Sources)
When the first assumption about the future implementation of multithreading is made, you need to inform the "advisor". The so-called annotations are used for this - special macros (or function calls, depending on the language), which are understandable by the Advisor, but do not affect the functioning of your program.
In Visual Studio, annotations are added using the context menu - just select the block of code you like and launch the Annotation Wizard:

Advisor XE annotations are of several types. To simulate the loop parallelization, we will need two main ones - “Annotate Site” and “Annotate Task”.
“Annotate Site” is used to mark the boundaries of a parallel region in the code. For C ++, it is represented by macros ANNOTATE_SITE_BEGIN and ANNOTATE_SITE_END. In our example, we will parallelize the for loop, breaking the iteration space into smaller chunks, so that each such chunk can run in parallel with the others.
“Annotate Task” is used to mark the boundaries of a single task using the ANNOTATE_TASK_BEGIN and ANNOTATE_TASK_END macros. A task is a block of code that can be executed repeatedly by different threads. Tasks are executed in parallel with other tasks and the rest of the code in a parallel region.
So proceed to the markup. We enclose the whole for loop in a parallel region. And we denote the cycle body as a task, since it will be executed in parallel (in the model) over different iterations:
#include <advisor-annotate.h> ... static void parallel_thread (void) { ANNOTATE_SITE_BEGIN(allRows); for (int y = starty; y < stopy; y++) { ANNOTATE_TASK_BEGIN(eachRow); m_storage.serial = 1; m_storage.mboxsize = sizeof(unsigned int)*(max_objectid() + 20); m_storage.local_mbox = (unsigned int *) malloc(m_storage.mboxsize); memset(m_storage.local_mbox,0,m_storage.mboxsize); drawing_area drawing(startx, totaly-y, stopx-startx, 1); for (int x = startx; x < stopx; x++) { color_t c = render_one_pixel (x, y, m_storage.local_mbox, m_storage.serial, startx, stopx, starty, stopy); drawing.put_pixel(c); } if(!video->next_frame()) { free(m_storage.local_mbox); return; } free(m_storage.local_mbox); ANNOTATE_TASK_END(eachRow); } ANNOTATE_SITE_END(allRows); } In order for the C ++ program to be compiled with annotations, you need to include the header file advisor-annotate.h.
Step 3. Check Efficiency (Check Suitability)
In the third step, Advisor XE does the re-profiling. The difference from the first profiling is that now it is not information about “hot functions” that is collected, but the parallel execution of the application is simulated and its potential operation speed is estimated.
The program is executed in the same way as without annotations - in single-threaded mode. The speed of work and the correctness of the results do not suffer. However, annotations allow the tool to simulate a multi-threaded execution of annotated code and give an evaluation of the effectiveness in numbers to the programmer’s court:

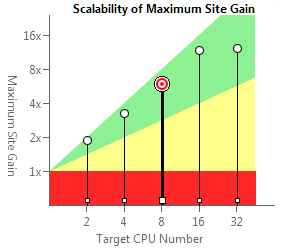
The result of evaluating the effectiveness (or suitability analysis) gives us a lot of interesting information:
- Acceleration of the entire program compared with the sequential execution (in our example, 1.48x)
- Acceleration of a separate parallel region (in the example 7.88 on 8 cores)
- Scalability estimation for 2-32 processor cores
- Details about parallel regions and tasks (execution time, number of tasks, etc.)
This information can be obtained for a different number of cores by switching the corresponding checkbox. Those. even working on a dual-core laptop, you can evaluate how the program will scale on a multi-core server.
In fairness, I must say that the results will not always be so rosy. It may turn out that the predicted positive effect from parallelization is not so high, or even zero. But this result will also be useful, since you will be convinced of the inefficiency of the chosen approach, and you will look for other ways. This is the purpose of Advisor XE - to give the opportunity to try many approaches to parallelization, spending a minimum of time and effort, and choose the best one.
It may happen that all the approaches tested do not give an acceptable result. This may give you the idea of changing the structure of the code so that it is easier to parallelize. Of course, Advisor XE will not provide extensive consultations on this score, but you should pay attention to the list of tips - perhaps some information will prompt you to think correctly.
Step 4. Check Correctness
Turning a single-threaded program into a multi-threaded program can lead to new bugs, such as data races. To facilitate verification and debugging in a “live” program, Advisor XE allows you to assess the correctness of the solution modeled by the programmer. To do this, you need to recompile the program in the “Debug” mode and run the Advisor XE - “Check Correctness” correctness check.
Validation will slow down the execution of the program, since the executable file is subjected to binary instrumentation, which helps Advisor XE to track the program for errors. Therefore, it makes sense to reduce the load on the application, if possible - to reduce the size of the input data, to reduce the frequency of updating frames, etc.

As a result of the check, the Correctness Report appears. It includes a list of errors, their type, a parallel region in which they appear. By double-clicking on the error, you can go to the source view, where additional information appears, for example, call stacks:

In our example, the data race was discovered - the global variable g_updates is incremented in the video :: next_frame () function. While the program does not affect the performance, because in reality the code is still single-threaded. However, it is obvious that the problem will have to be resolved, and this will have an impact on performance - synchronization objects may appear that hold back scalability, or vice versa, localization of variables will have a positive effect.
To check this out, Advisor XE has another type of annotation - “Lock Annotations”. They are used to model critical sections. In our example, g_updates is modified in the video :: next_frame () function, which is called in our parallelized loop. Therefore, we can protect it with synchronization annotations here:
static void parallel_thread (void) { ANNOTATE_SITE_BEGIN(allRows); for (int y = starty; y < stopy; y++) { ANNOTATE_TASK_BEGIN(eachRow); m_storage.serial = 1; m_storage.mboxsize = sizeof(unsigned int)*(max_objectid() + 20); m_storage.local_mbox = (unsigned int *) malloc(m_storage.mboxsize); memset(m_storage.local_mbox,0,m_storage.mboxsize); drawing_area drawing(startx, totaly-y, stopx-startx, 1); for (int x = startx; x < stopx; x++) { color_t c = render_one_pixel (x, y, m_storage.local_mbox, m_storage.serial, startx, stopx, starty, stopy); drawing.put_pixel(c); } ANNOTATE_LOCK_ACQUIRE(0); if(!video->next_frame()) { ANNOTATE_LOCK_RELEASE(0); free(m_storage.local_mbox); return; } ANNOTATE_LOCK_RELEASE(0); free(m_storage.local_mbox); ANNOTATE_TASK_END(eachRow); } ANNOTATE_SITE_END(allRows); } After the done changes, we reassemble the program and check it again. It is possible to check for correctness - whether the problem is solved, and for performance - what the effect of parallelization will be in view of the presence of a critical section. In our example, the introduction of the critical section had almost no effect on performance.
Step 5. Implement Parallelization (Add Parallel Framework)
The last stage of code parallelization is actually parallelization, i.e. selection of streaming API, direct encoding and debugging. This step is only conditionally included in the “workflow” Advisor XE, so as not to forget, so to speak. The “Advisor” is intended only for modeling and providing the developer with analytical information, on the basis of which he will have a clearer idea of where to go next - what should be modified and how, what effect to expect and what problems may arise. Then you have to act yourself.
But do not be discouraged - in the package Intel Parallel Studio XE there are many more tools that will help in other stages. To implement a parallel loop on the model in the above example, you can use a set of high-level "parallel frameworks" that allow you to abstract from the independent creation of threads and load distribution between them. For example, you can convert a serial loop to a parallel one using Intel Cilk Plus. You will need to use the Intel compiler. And as a synchronization primitive you can take tbb :: spin_mutex from the Intel TBB library. The code of the cycle (already parallel) will look like this:
static void parallel_thread (void) { volatile bool continue_work = true; cilk_for (int y = starty; y < stopy; y++) { if (continue_work) { storage m_storage; m_storage.serial = 1; m_storage.mboxsize = sizeof(unsigned int)*(max_objectid() + 20); m_storage.local_mbox = (unsigned int *) malloc(m_storage.mboxsize); memset(m_storage.local_mbox,0,m_storage.mboxsize); drawing_area drawing(startx, totaly-y, stopx-startx, 1); for (int x = startx; x < stopx; x++) { color_t c = render_one_pixel (x, y, m_storage.local_mbox, m_storage.serial, startx, stopx, starty, stopy); drawing.put_pixel(c); } { tbb::spin_mutex::scoped_lock lockUntilScopeExit(MyMutex); if(!video->next_frame()) { continue_work = false; } } free (m_storage.local_mbox); } } } findings
Advisor XE will be useful where there is already a working code that needs to be partially parallelized. For example, there is an old science application in Fortran that needs to be optimized for a new server or cluster. The main advantage of the tool is the ability to quickly simulate multi-threaded execution. After conducting several experiments, you can determine the code points on which it is worthwhile to concentrate efforts, and understand what to expect from this — how much parallelization can be useful for, how much scalability can be achieved. Doing the same thing “for real”, creating threads and reshaping the code, takes a lot more effort.
You can download the trial version of Intel Advisor XE from the product site:
http://software.intel.com/en-us/intel-advisor-xe .
Intel Parallel Studio XE 2013:
http://software.intel.com/en-us/intel-parallel-studio-xe/
Intel Cilk Plus
http://software.intel.com/en-us/intel-cilkplus-archive
Intel Threading Building Blocks
http://software.intel.com/en-us/intel-tbb
http://threadingbuildingblocks.org/
Source: https://habr.com/ru/post/152086/
All Articles