Moscow Air Quality Monitoring System
This post describes the Moscow air quality monitoring system created in the form of a kickstarter project vozduh.msk.ru . First there will be a few words about why the air is interesting to monitor and why there are not enough existing systems for this. Then there will be a story about raising funds for the project (with numbers). Then there will be a story about the architecture of the system, its characteristics, strengths and limitations.
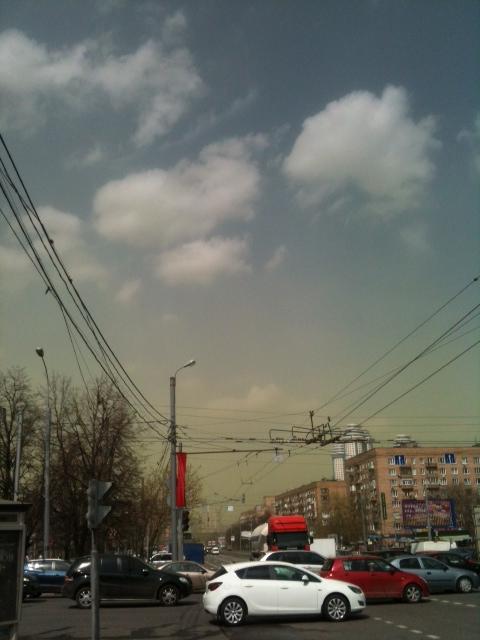
On April 26, 2012, Moscow was covered with a dense yellow-green cloud. Along with the cloud, rumors of some supposedly exploding fertilizer plant began to spread. But it soon became clear that there was no room for conspiracy: this spring a uniquely stormy birch bloom happened. The green cloud consisted of pollen. Allergy friends were sitting at home, tightly closing the windows.
')
But even without the ill-fated birch, the Moscow air is usually not mountainous purity. Many people returning from vacation complain of a characteristic condition resembling a mild degree of poisoning.
We knew two sources of data on air pollution in the city.
Judging by the data of mosomic monitoring, the concentration of pollutant gas impurities in the Moscow air is usually at the acceptable level. Those. anything can happen (especially in the Avtozavodskaya region), but in general, judging by these data, our air is about the same as in other megalopolises. So there are other factors that have a significant impact on people's health.
There was a hypothesis: an important contribution to the air quality is made by the “invisible” dust monitoring.
In the price range of "up to $ 1000", in which I decided to look for solutions, there are two popular dust sensors: Sharp firms with the easily remembered GP2Y1010AU0F name for $ 12 and the DC1100 pro meter from Dylos for $ 290. The advantages of the first is its low price. Otherwise, it is inferior to Dylos, since this latter can measure individual indicators for fine (<2.5 um) and coarse dust. This gave hope that the readings of the device could lead to a universal indicator PM2.5, which is used in the calculation of AQI. Looking ahead to say that this hope was not destined to come true.
On June 21, 2012, in my LiveJournal, Friends and Facebook, I announced the start of fundraising for the purchase of a DC1100 dust meter. Thanks to the help of friends in six days, we managed to collect even a little more than was required, about $ 420. A wonderful optical rain sensor was purchased for this excess, because it seemed likely that rain had a strong effect on dust. Once again, running ahead, I will say that the strong connection between rain and dust levels was confirmed.
For me, the success of domestic online financing was a pleasant surprise. It is customary to see collections of funds to help people who are in difficult circumstances, need money. Therefore, I was not at all sure that a private air monitoring project, which is essentially a research (and declared in that capacity) project, will be able to receive funding. The more pleasant was the result. He says that the problem is relevant and worries many people.
On July 20, the sensors reached Moscow; in the twentieth of August, the project was launched in a semi-industrial mode. Now on the project site published relevant data, but the site is actively being finalized.
The system consists of three modules: meter, intermediate server and data publishing servers.
The data from the sensors of dust, rain, temperature and humidity are read by an arduino-based meter and are sent in json-format via a Xbee link to the home server. There they are logged and sent for publication on cosm.com and vozduh.msk.ru.

The air driven by the fan (8) from the street through the pipe (2) passes through the heating element (3) in order, if necessary, to reduce the relative humidity of the air and prevent the influence of water vapor on the measurement results. The course of air is shown by arrows. The control circuit (5) based on the arduino uno platform, using data from the humidity sensor (6), controls the heater (3) using a power relay (7).
Data from the DC1100 (4) and the rain sensor (not shown in the diagram) is read by the control circuit (5) and transmitted via the XBee card to the home server, where it is processed and sent for publication on a publicly accessible website.
FreeBSD 9.0 on an old laptop with a broken screen. Himself, without dancing with a tambourine, I saw ftdi-shnuyu card with the Xbee module, rubevy data import script is spinning in the screenshot.
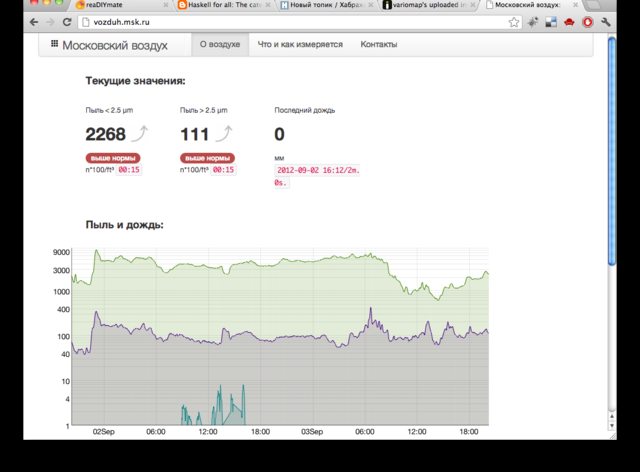
Now the data are published in two places: on cosm.com and vozduh.msk.ru. Vozduh is a ruby-sinatra script, graphics are drawn using the dygraphs library. Charts are displayed smoothed at 10-minute intervals; Those who are curious "raw" data can see them on the appropriate page .
On vozduh-e minimum statistics are bolted: quantiles for dust measurements and trends are calculated in accordance with the linear model. Statistics are computed using a small R script that directly reads and writes data from a database (SQLite).
In my opinion, the project can be considered successful. First of all, this is the first popular-funded project of air monitoring in our country known to me. Secondly, accurate data on two atmospheric pollutants: coarse and fine dust are published every minute. This information was not available until project implementation.
Data on air pollution by dust is very curious. It is known, for example, that dust storms from central Africa reach the shores of North America, traveling thousands of kilometers. Our measurements suggest that the amount of fine dust varies little when moving over distances of hundreds of kilometers. On one of the days, I took testimony consistently in the south-west of Moscow, on the Moscow Ring Road and in the city of Dubna. The readings were very close. In this case, over time, contamination levels can change rapidly, several times over several hours. This makes the values of this parameter promising for interpretation.
Unfortunately, it was not possible to turn the measurement of dust into the PM2.5 indicator generally accepted in this matter. The fact is that DC1100 shows the amount of dust particles per unit volume of air, and PM2.5 shows the mass of dust per unit volume. Despite the fact that attempts have been made to convert one into another, my best understanding at the current moment is that it is impossible to do this correctly. I can address those interested in the work [5].
Further development plans for the project include:
I will be glad to other ideas on the development of the project and wishing to take part in it.
From birch to arduino
On April 26, 2012, Moscow was covered with a dense yellow-green cloud. Along with the cloud, rumors of some supposedly exploding fertilizer plant began to spread. But it soon became clear that there was no room for conspiracy: this spring a uniquely stormy birch bloom happened. The green cloud consisted of pollen. Allergy friends were sitting at home, tightly closing the windows.
')
But even without the ill-fated birch, the Moscow air is usually not mountainous purity. Many people returning from vacation complain of a characteristic condition resembling a mild degree of poisoning.
We knew two sources of data on air pollution in the city.
- Mosomomonitoring . Measures the content of sulfur dioxide, nitrogen dioxide and other gases. This system does not monitor (or does not publish) accurate data on air pollution from solid particles (dust, smoke, pollen).
- Site of the manufacturer of antiallergenic drug. These data do not take into account dust and smoke, and also are not operational, the delay reaches several days.
Judging by the data of mosomic monitoring, the concentration of pollutant gas impurities in the Moscow air is usually at the acceptable level. Those. anything can happen (especially in the Avtozavodskaya region), but in general, judging by these data, our air is about the same as in other megalopolises. So there are other factors that have a significant impact on people's health.
How is air monitored in the west
The integrated air quality indicator called AQI (Air Quality Index) is widely used in the world. It takes into account air pollution with ozone, carbon monoxide, sulfur dioxide, nitrogen dioxide and particulate matter. Our AQI is not published, and as far as I understand, there is no complete data for its calculation.
In addition to the network of state stations for monitoring air quality in the west, private, civil monitoring is widely developed. Probably the most famous project in this activity is “ Air Quality Egg,” Air quality egg .
In addition to the network of state stations for monitoring air quality in the west, private, civil monitoring is widely developed. Probably the most famous project in this activity is “ Air Quality Egg,” Air quality egg .
There was a hypothesis: an important contribution to the air quality is made by the “invisible” dust monitoring.
Kickstart project.
In the price range of "up to $ 1000", in which I decided to look for solutions, there are two popular dust sensors: Sharp firms with the easily remembered GP2Y1010AU0F name for $ 12 and the DC1100 pro meter from Dylos for $ 290. The advantages of the first is its low price. Otherwise, it is inferior to Dylos, since this latter can measure individual indicators for fine (<2.5 um) and coarse dust. This gave hope that the readings of the device could lead to a universal indicator PM2.5, which is used in the calculation of AQI. Looking ahead to say that this hope was not destined to come true.
On June 21, 2012, in my LiveJournal, Friends and Facebook, I announced the start of fundraising for the purchase of a DC1100 dust meter. Thanks to the help of friends in six days, we managed to collect even a little more than was required, about $ 420. A wonderful optical rain sensor was purchased for this excess, because it seemed likely that rain had a strong effect on dust. Once again, running ahead, I will say that the strong connection between rain and dust levels was confirmed.
For me, the success of domestic online financing was a pleasant surprise. It is customary to see collections of funds to help people who are in difficult circumstances, need money. Therefore, I was not at all sure that a private air monitoring project, which is essentially a research (and declared in that capacity) project, will be able to receive funding. The more pleasant was the result. He says that the problem is relevant and worries many people.
On July 20, the sensors reached Moscow; in the twentieth of August, the project was launched in a semi-industrial mode. Now on the project site published relevant data, but the site is actively being finalized.
Gears
Architecture
The system consists of three modules: meter, intermediate server and data publishing servers.
The data from the sensors of dust, rain, temperature and humidity are read by an arduino-based meter and are sent in json-format via a Xbee link to the home server. There they are logged and sent for publication on cosm.com and vozduh.msk.ru.
Meter
The air driven by the fan (8) from the street through the pipe (2) passes through the heating element (3) in order, if necessary, to reduce the relative humidity of the air and prevent the influence of water vapor on the measurement results. The course of air is shown by arrows. The control circuit (5) based on the arduino uno platform, using data from the humidity sensor (6), controls the heater (3) using a power relay (7).
Data from the DC1100 (4) and the rain sensor (not shown in the diagram) is read by the control circuit (5) and transmitted via the XBee card to the home server, where it is processed and sent for publication on a publicly accessible website.
   |
| From left to right: the appearance of the meter unit, the housing with the cover removed and the DC1100, the rain sensor during testing. (pictures are clickable) |
Home server
FreeBSD 9.0 on an old laptop with a broken screen. Himself, without dancing with a tambourine, I saw ftdi-shnuyu card with the Xbee module, rubevy data import script is spinning in the screenshot.
Publishing server
Now the data are published in two places: on cosm.com and vozduh.msk.ru. Vozduh is a ruby-sinatra script, graphics are drawn using the dygraphs library. Charts are displayed smoothed at 10-minute intervals; Those who are curious "raw" data can see them on the appropriate page .
On vozduh-e minimum statistics are bolted: quantiles for dust measurements and trends are calculated in accordance with the linear model. Statistics are computed using a small R script that directly reads and writes data from a database (SQLite).
Conclusion, conclusions and directions of the project development
In my opinion, the project can be considered successful. First of all, this is the first popular-funded project of air monitoring in our country known to me. Secondly, accurate data on two atmospheric pollutants: coarse and fine dust are published every minute. This information was not available until project implementation.
Data on air pollution by dust is very curious. It is known, for example, that dust storms from central Africa reach the shores of North America, traveling thousands of kilometers. Our measurements suggest that the amount of fine dust varies little when moving over distances of hundreds of kilometers. On one of the days, I took testimony consistently in the south-west of Moscow, on the Moscow Ring Road and in the city of Dubna. The readings were very close. In this case, over time, contamination levels can change rapidly, several times over several hours. This makes the values of this parameter promising for interpretation.
Unfortunately, it was not possible to turn the measurement of dust into the PM2.5 indicator generally accepted in this matter. The fact is that DC1100 shows the amount of dust particles per unit volume of air, and PM2.5 shows the mass of dust per unit volume. Despite the fact that attempts have been made to convert one into another, my best understanding at the current moment is that it is impossible to do this correctly. I can address those interested in the work [5].
Further development plans for the project include:
- Sensor network. It would be very curious to see dust moving at significant distances. If there is funding for the manufacture of several measurement points, it will be possible to study the movement of dust and rain over Moscow and other cities.
- API. This is one of the priority things that will soon appear on the site.
- Twitter. Planned feed informing about what is happening in the air of the city. May be useful to athletes and allergies. Or maybe anyone who is curious about whether it was raining at night, for example.
- Mobile client. One more stage from the list of the nearest.
I will be glad to other ideas on the development of the project and wishing to take part in it.
Links
- Project website: vozduh.msk.ru
- Sources of all software: github.com/ati/air-quality
- Indicators of air quality: sir35.ru/Pokazateli-kachestva-vozduxa.html
- Air quality egg, civilian air quality monitoring system - www.kickstarter.com/projects/edborden/air-quality-egg
- CN Davies. Size distribution of atmospheric particles - www.sciencedirect.com/science/article/pii/0021850274900639
Source: https://habr.com/ru/post/150807/
All Articles