Real-time log analysis
Modern monitoring systems “out of the box” allow you to track almost all indicators of a separate system node, but they have a number of significant drawbacks.
At the baseline, our site has more than 1,000,000 unique, ~ 100,000,000 http requests for frontend per day and a spreading zoo of projects in terms of maintenance. A set of keywords - nginx, apache, php (two variations), oracle. With an inveterate periodicity, there are situations “everything works for us” according to individual areas of responsibility or, which is also not uncommon, “nothing works for you”. At the boundaries of responsibility is a continuous transfer of tickets.
We did not reinvent the wheel and decided to monitor the time and correctness of the response to the user with tracking the response of the backends, as well as which of them were involved in processing a specific request. Well, plus our volumes are not very large, but a few rakes can be shown along the way.
What we got in the end.
')
If there are more than one nodes in the system, then it would be nice to have a way to track one request from front through the entire system. If there are dozens of nodes, the client IP will not help. If there is a base at the bottom, DBA will sometimes run with a soldering iron and the phrase “whose request ???”. Well, the standard combined simply does not contain any information about the processing time on the backend, getting into the cache, selected upstream, and the time it takes to return data to the user. In standard nginx modules there is almost everything that we may need. We have added only one module from HeadHunter.
github.com/hhru/nginx_requestid , assigning a unique identifier to each request on nginx and allowing to write it to the log, as well as forward it up and down in the headers. The final format of our nginx log is as follows.

Fearfully? It is more fun that in the upstream type fields there can be the following things “upstream_1: upstream_2”, for all the backends that processed this request. Request_id has already been described, the last two uid_got, uid_set is the ngx_http_userid module, which allows you to keep track of a specific user by installing a system cookie for him. Why four spaces are used as a separator will be described in the parsing section. At the Apache or php-fpm level, it makes sense to write the request_id that came from above to the logs, and give the host name to the top, if the request balancer is specified as the upstream. At the application level, it is worthwhile to create a rule to specify request_id in error messages. I described one of the ways to forward request data to an Oracle session in a small note . Its advantage is that it is not necessary to ask developers to do the same with their means and there is a guarantee that the data will appear for all projects at once. It also makes sense to look in the direction of pinba or xhprof to track the waiting time for external resources (base, api services, system calls) for each request and the average for the project / site. Our adapted solution in this area will be ready closer to winter.
The further presentation is devoted to our attempt to analyze logs using the example of nginx logs - as the most informative and voluminous in our system at the moment.
The standard de facto in the aggregation of logs is various forks and descendants of syslog. UDP is used as a transport to avoid overhead in the form of maintaining a connection and guaranteeing delivery. You can afford to lose a few percent of messages in the normal mode, more global losses will be associated with global problems of your infrastructure, which you will learn about from other sources. More information about the pitfalls on a large stream of messages can be found in the report of the Director of Operation hh.ru “Experience in the transition to SOA” www.slideshare.net/kuchinskaya/sivko , it considered several options for collecting logs in a single place. In addition to delivery via udp, it makes sense to collect logs into a single file storage for the future.
Initially, the second part of the problem was solved on our site - all logs are initially written to the network storage. To simplify the prototype of our analyzer, we simply read the logs on nfs. What is bad in principle - logging spends the resources of the entire system around the clock, the availability of logs depends on the health of the network storage (have you never dropped NetApp in the middle of a working day?), Buffering the record complicates the log parsing algorithm. Also, a line is written to the log file in text format, if you send data about the request in a serialized form - we avoid the cost of parsing on the receiver side.
In our case, the parser is written in Perl, the data is put in MongoDB 2.2.0. The algorithm is simple to disgrace - we remember the last processed position in the file, we compare the current size, if the delta is greater than the cutoff - we send to the file parsing, in the parsing we check the correctness of the record (do we remember everything about record buffering?). From rake
All these charms can be avoided by sending data on udp.
It is possible to store all the data for a long time together with the indexes, but VERY expensive. In real life, temporary storage is used with the ability to build analytics with data for the last several hours - a day. For on-line diagnostics, more data does not make sense; globally historical reports can always be constructed from raw data.
We use MongoDB because ... we wanted to. Roughly, but it is - you can choose any tool in which you will be ready to implement such a system. The more convenient and fast is the grouping of records and updating data in the repository, the better.
From Mongo's secular advantages
Rake
Despite the second rake, a relatively complex request to “figure out the top-50 IP by the number of requests, load on the backend, traffic in the last minute” is calculated for 800-1200 ms. In our case, one piece of hardware serves to write data and wipe them out (master), to the second there is a replica so that the analysts do not slow down the recording.
There is also a desire to try out the mail Tarantool (tarantool.org) - before correcting the rake in the parser with regexp, he showed not very nice figures on the speed of data loading. After the correction, it was not tested, I hope for pleasant surprises.
Of the potential benefits of Tarantool
At the previous stages we received an array of records from the log files of the nodes of our system, which is available for quick search and grouping according to the necessary rules. Our Perl test script prepares the data in the following section.
where is the field gf
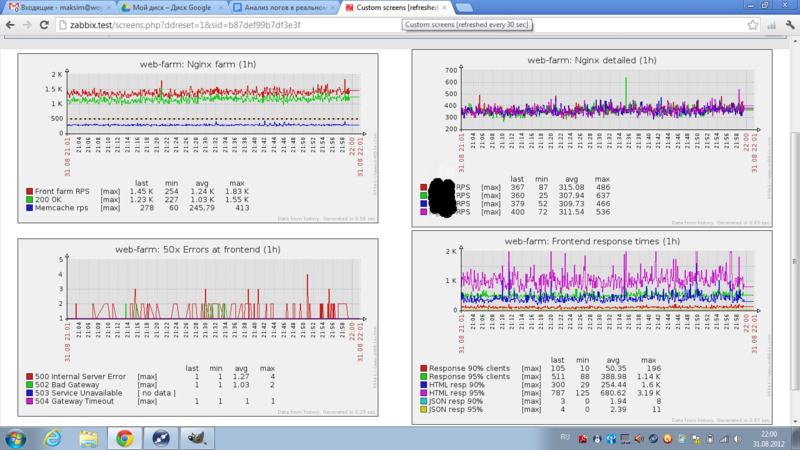
At the output, we obtain a link to an array of previously grouped data, which we later turn into final metrics. In our case, we are interested in general coolness metrics = site load, response time to end users in general / by content type, the effectiveness of our caches, the number of errors. An approximate picture of the site as a whole may look like the screenshot at the beginning of the post. The sets of project / system metrics are formed from the wishes of the operation service, administrative groups (for example, we have a separate screen devoted to requests for a full-text index from different projects — to see the source of the load on a node), developers, site owners and direct guidance. After the first demonstration, one or two screens per week began to form from our wishes.
The key requirement for the calculation is that the calculation time for the time interval and the load on the monitoring systems should be less than this interval.
We have this time about 100-200 ms per second interval. The second interval is selected at the stage of the assembly of the designer to run everything in the most severe conditions. In reality, 5/10/30/60-second average values have more rights to life.
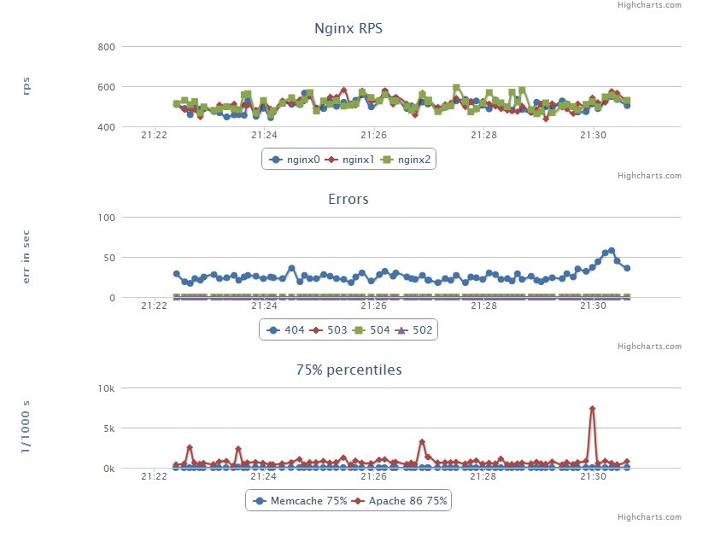
First, the data must somehow be beautifully displayed. At the debugging stage of the previous steps, the highcharts library was used, the data was taken from MongoDB, where it was added by the script from point 4.
In the future, key wishes were formed to the monitoring system, where we would load the data
Not so much, zabbix quite approached us, which is shown on the title screen. Here, as with mongo, it all depends on personal preferences and the specific situation. Their metrics are started up with the zabbix trapper type, and the data is loaded by the zabbix_sender utility in batch mode, as the base of mysql. Loading hundreds of values takes 1-2ms.
After the work done, which took about a man-month in the background, we had
To the paths of development
If there is a desire to plunge into the topic in more detail - the topic of monitoring and profiling has been raised several times over at the pros parties over the past year, if there are references to similar publications in the comments - I will only be happy.
This note outlines the main contours of our system, which is just beginning to grow into concrete. The initial steps are the most important and I will be glad to hear what the basis of your systems is - principles and technologies.
- knowing all about one node, they don’t have any idea about the system’s operation - try to give out to the management from the box “at the moment we have 1200RPS on the front, 90% of pages are given for 300ms, 95% for 650mc, system errors and timeouts occur less 10 per second "(see picture under the cut)
- going beyond one of the system indicators of one of the nodes of the system does not mean that it is worth sounding the alarm - perhaps the node has become under increased load, or the developers have changed the algorithm
- within the monitoring of individual nodes it is almost impossible to keep track of the gradual degradation of the service - as a rule, it only works when “nothing works”
- degradation of external services performance is not monitored in principle (have you ever banned CDN?)
At the baseline, our site has more than 1,000,000 unique, ~ 100,000,000 http requests for frontend per day and a spreading zoo of projects in terms of maintenance. A set of keywords - nginx, apache, php (two variations), oracle. With an inveterate periodicity, there are situations “everything works for us” according to individual areas of responsibility or, which is also not uncommon, “nothing works for you”. At the boundaries of responsibility is a continuous transfer of tickets.
We did not reinvent the wheel and decided to monitor the time and correctness of the response to the user with tracking the response of the backends, as well as which of them were involved in processing a specific request. Well, plus our volumes are not very large, but a few rakes can be shown along the way.
What we got in the end.
')
1. Preparation of the initial data.
If there are more than one nodes in the system, then it would be nice to have a way to track one request from front through the entire system. If there are dozens of nodes, the client IP will not help. If there is a base at the bottom, DBA will sometimes run with a soldering iron and the phrase “whose request ???”. Well, the standard combined simply does not contain any information about the processing time on the backend, getting into the cache, selected upstream, and the time it takes to return data to the user. In standard nginx modules there is almost everything that we may need. We have added only one module from HeadHunter.
github.com/hhru/nginx_requestid , assigning a unique identifier to each request on nginx and allowing to write it to the log, as well as forward it up and down in the headers. The final format of our nginx log is as follows.
Fearfully? It is more fun that in the upstream type fields there can be the following things “upstream_1: upstream_2”, for all the backends that processed this request. Request_id has already been described, the last two uid_got, uid_set is the ngx_http_userid module, which allows you to keep track of a specific user by installing a system cookie for him. Why four spaces are used as a separator will be described in the parsing section. At the Apache or php-fpm level, it makes sense to write the request_id that came from above to the logs, and give the host name to the top, if the request balancer is specified as the upstream. At the application level, it is worthwhile to create a rule to specify request_id in error messages. I described one of the ways to forward request data to an Oracle session in a small note . Its advantage is that it is not necessary to ask developers to do the same with their means and there is a guarantee that the data will appear for all projects at once. It also makes sense to look in the direction of pinba or xhprof to track the waiting time for external resources (base, api services, system calls) for each request and the average for the project / site. Our adapted solution in this area will be ready closer to winter.
The further presentation is devoted to our attempt to analyze logs using the example of nginx logs - as the most informative and voluminous in our system at the moment.
2. Collecting logs in a single center.
The standard de facto in the aggregation of logs is various forks and descendants of syslog. UDP is used as a transport to avoid overhead in the form of maintaining a connection and guaranteeing delivery. You can afford to lose a few percent of messages in the normal mode, more global losses will be associated with global problems of your infrastructure, which you will learn about from other sources. More information about the pitfalls on a large stream of messages can be found in the report of the Director of Operation hh.ru “Experience in the transition to SOA” www.slideshare.net/kuchinskaya/sivko , it considered several options for collecting logs in a single place. In addition to delivery via udp, it makes sense to collect logs into a single file storage for the future.
Initially, the second part of the problem was solved on our site - all logs are initially written to the network storage. To simplify the prototype of our analyzer, we simply read the logs on nfs. What is bad in principle - logging spends the resources of the entire system around the clock, the availability of logs depends on the health of the network storage (have you never dropped NetApp in the middle of a working day?), Buffering the record complicates the log parsing algorithm. Also, a line is written to the log file in text format, if you send data about the request in a serialized form - we avoid the cost of parsing on the receiver side.
2.5 Parsing logs.
In our case, the parser is written in Perl, the data is put in MongoDB 2.2.0. The algorithm is simple to disgrace - we remember the last processed position in the file, we compare the current size, if the delta is greater than the cutoff - we send to the file parsing, in the parsing we check the correctness of the record (do we remember everything about record buffering?). From rake
- if there are many files, store descriptors, instead of opening the file every time, there is not much time, but the repository will be more pleasant
- reg exp in our format handled 700 lines per second, after switching to a format with a standard separator and replacing the regular time with split, the speed increased to 10-20 thousand lines per second. Here, numbers speak better than inner convictions.
- if the iteration time is less than two or three seconds - make a small sleep, the storage will be even more pleasant that it is not pulled on the stat hundreds of files every second
- batch_insert will make a nice base, but mongo has a 16MB limit on one insert call (4MB to 2.2)
All these charms can be avoided by sending data on udp.
3. Temporary storage for analytics and search.
It is possible to store all the data for a long time together with the indexes, but VERY expensive. In real life, temporary storage is used with the ability to build analytics with data for the last several hours - a day. For on-line diagnostics, more data does not make sense; globally historical reports can always be constructed from raw data.
We use MongoDB because ... we wanted to. Roughly, but it is - you can choose any tool in which you will be ready to implement such a system. The more convenient and fast is the grouping of records and updating data in the repository, the better.
From Mongo's secular advantages
- capped collections - the fifo collection of records, in our case, the 3GB collection is enough for now; its files are on ramdisk
- aggregation framework - a new feature from version 2.2, for our tasks it groups per second 1.200-10.000 for 50-200ms
- ttl collections - collections where you can specify the lifetime of records (analogous to expire in memcache), imho is somewhat raw
- write speed in one stream - 5-6 thousand records per second, can be scaled by several write streams
Rake
- in version 2.2.0-rc0, in aggregation $ project it was possible to transfer to the operator $ add strings, thus the group key was formed from several fields, in version 2.2.0-rc1 and above there is no such possibility, and the operator $ concat is promised in 2.3. x without any deadlines. I had to bypass a level above, in the parser - by writing a group key to each record
- the more indexes are created, the slower the insertion will be. The less indexes - the less opportunity to search. We now have two indexes - the system identifier and the timestamp from the record. More on the test stand, we can not afford.
- capped collection does not have any built-in tools; you have to do this at the application level.
Despite the second rake, a relatively complex request to “figure out the top-50 IP by the number of requests, load on the backend, traffic in the last minute” is calculated for 800-1200 ms. In our case, one piece of hardware serves to write data and wipe them out (master), to the second there is a replica so that the analysts do not slow down the recording.
There is also a desire to try out the mail Tarantool (tarantool.org) - before correcting the rake in the parser with regexp, he showed not very nice figures on the speed of data loading. After the correction, it was not tested, I hope for pleasant surprises.
Of the potential benefits of Tarantool
- memory based database
- built-in lua language for stored procedures
- availability of the author in Russian and high perfomance parties in Moscow
4. Aggregates, percentiles ...
At the previous stages we received an array of records from the log files of the nodes of our system, which is available for quick search and grouping according to the necessary rules. Our Perl test script prepares the data in the following section.
my $res3=$slave->logs2->run_command( { aggregate=>'lines', pipeline=>[ {'$match'=>{'tstamp'=>{'$lt'=>$i,'$gte'=>$i-1}}}, {'$project'=>{ 'gf'=>1, 'upstream_time'=>1 ,'resp_time'=>1 ,'size'=>1 } }, {'$group'=>{'_id'=>'$gf',total=>{'$sum'=>1},traffic=>{'$sum'=>'$size'},'times'=>{'$push'=>'$upstream_time'},'response'=>{'$push'=>'$resp_time'}}} ] } ); where is the field gf
$inf{gf}=join(' ',($inf{upstream},$inf{code},$inf{host},$inf{backend},$inf{frontend},$inf{cache_status},$inf{content_type},$inf{url},$inf{upstream_code})); At the output, we obtain a link to an array of previously grouped data, which we later turn into final metrics. In our case, we are interested in general coolness metrics = site load, response time to end users in general / by content type, the effectiveness of our caches, the number of errors. An approximate picture of the site as a whole may look like the screenshot at the beginning of the post. The sets of project / system metrics are formed from the wishes of the operation service, administrative groups (for example, we have a separate screen devoted to requests for a full-text index from different projects — to see the source of the load on a node), developers, site owners and direct guidance. After the first demonstration, one or two screens per week began to form from our wishes.
The key requirement for the calculation is that the calculation time for the time interval and the load on the monitoring systems should be less than this interval.
We have this time about 100-200 ms per second interval. The second interval is selected at the stage of the assembly of the designer to run everything in the most severe conditions. In reality, 5/10/30/60-second average values have more rights to life.
5. We counted and what's next?
First, the data must somehow be beautifully displayed. At the debugging stage of the previous steps, the highcharts library was used, the data was taken from MongoDB, where it was added by the script from point 4.
- does not solve the issues of arbitrary formation of a set of graphs on the page by the end user
- not adapted for monitoring tasks in principle (no tracking of boundary values, calculation of service availability by SLA, etc.)
- provided a wow effect
In the future, key wishes were formed to the monitoring system, where we would load the data
- opportunity to get your own metrics
- upload them outside (api / soft for download)
Not so much, zabbix quite approached us, which is shown on the title screen. Here, as with mongo, it all depends on personal preferences and the specific situation. Their metrics are started up with the zabbix trapper type, and the data is loaded by the zabbix_sender utility in batch mode, as the base of mysql. Loading hundreds of values takes 1-2ms.
6. Results
After the work done, which took about a man-month in the background, we had
- up-to-date information on selected metrics with a delay of 90 seconds (time of guaranteed recording through buffers, parsing, writing to Mongo, replicating to a slave, calculation)
- ability to track the processing of user requests for all nodes in the system (ngx_request_id)
- understanding at the lowest level - db, than it is loaded from above (forwarding host, request_uri, request_id inside the information about the sessions)
- statistics on the use of full-text search service projects
- a look at the site from the perspective of the service provided - the generation and distribution of content by many projects
- problem-specific metrics that are specific to individual projects and the site as a whole
- beautiful pictures for guidance
- platform for the implementation of the most possible womens (should be the zero point at the current stage)
To the paths of development
- track how bullets fly to the end user (load time and display of all page elements)
- window shortening from 90 to 30 seconds
- algorithms for tracking the gradual degradation of service
- search by raw data - here we collect a test bench with splunk and our data for two weeks
- xhprof adaptation to our wishes
If there is a desire to plunge into the topic in more detail - the topic of monitoring and profiling has been raised several times over at the pros parties over the past year, if there are references to similar publications in the comments - I will only be happy.
This note outlines the main contours of our system, which is just beginning to grow into concrete. The initial steps are the most important and I will be glad to hear what the basis of your systems is - principles and technologies.
Source: https://habr.com/ru/post/150657/
All Articles