Veeam One - VMware and Hyper-V Virtual Infrastructure Monitoring Software
Pushing off from the manufacturer used at the stand backup software - Veeam Backup & Replication - we went to the company's website and found there a ready-made solution - Veeam One . Under the cut a small review and impressions about this product.
The complex consists of three programs - Veeam Monitor, Veeam Reporter and Veeam Business View - each of which is responsible for its tasks, in general, clear from the names. There is also the Report Viewer, but it only allows you to view the current status of creating reports and helps to manage them.
The functional differences of the trial version from the full version fully allow you to thoroughly familiarize yourself with the product. And the developers' statements pleased: it is planned to develop synchronization with Backup & Replication and a handful of other products created by the developers of the company. Currently, connections between all applications of the complex are implemented, as well as Veeam Software: Veeam Reporter Enterprise, Veeam nworks Management Pack and nworks Smart Plug-in.
')
It’s too wasteful to monitor a separate server, so we decided to use an unloaded backup server (reporting, statistics, cluster data and backups in one place). Products are downloaded from the site separately, each of them has additional needs:

This label can be useful if you want to distribute products to various resources. Disabling the firewall is required to access the management snap-ins.
During installation, we chose the default settings, although there are several notes to them:
- it makes sense to set Cyrillic Collation to SQL, otherwise the reports will incorrectly display information in Cyrillic (some attributes and comments to the virtual machine can be entered in Russian in vCenter);
- It is recommended to disable the firewall - when enabled, data from the network is not always correctly collected;
- it does not hurt to also increase the size of the database from 10 to at least 15 GB. In the free version, we have accumulated over a week of 1.36 GB of data for 139 virtual machines (in the full version, it very quickly reaches 10 GB in six months).
Installation took only 5 minutes (despite the fact that the installation process was backed up).
So, consider the products closer. Veeam Monitor is the main data collector from the cluster, all data on the state of the virtual machine fleet flows here; Veeam Reporter - reporting tool; Business View allows you to use a custom view for future work with a VMware forest. The scheme is very simple:

Veeam Monitor
This application is the main in the complex - it collects and processes data on cluster elements. The program interface is very user friendly. Where and what to look for is intuitive.

Infrastructure View - vCenter tree view
There are two types of views in which we can view information of interest to us: the first, Infrastructure View, is unloaded from vCenter with an unchanged tree view; the second is the Business View, whose view is configured from the eponymous application included in the software package. We will return to it later, but for now we want to draw your attention to the Alarm Management tab.

Alarm management - the main monitoring setup window
This menu allows you to customize the collection of data that meets our needs, from tracking the occupied space to the very useful, though not very visual, filter of the Oversized Virtual Machine. The data it receives may be useful in planning the development of the infrastructure in the future - it detects virtual machines that do not use much of their resources.
In the free version, only the standard set of filters is available, in full, a full-featured editor. Some filters that are not available in the trial version automatically start immediately after adding a license, for example, Guest Disk Space Alarm - a filter that collects data on guest virtual machines added to the cluster (however, we advise you to disable it immediately and turn it on only when necessary there will be a lot of data about it, and the need for them is minimal).
Here you can also set up warnings and error notifications when they appear in the vCenter (this option is also available in the free version of the program).
Veeam Reporter and Veeam Report Viewer
Veeam Reporter is responsible for creating beautiful reports. Access to report creation can be obtained directly from Monitor (View Report button), while the report will contain data only on the selected category, for example, CPU load, etc. The program itself allows you to create reports of any complexity.
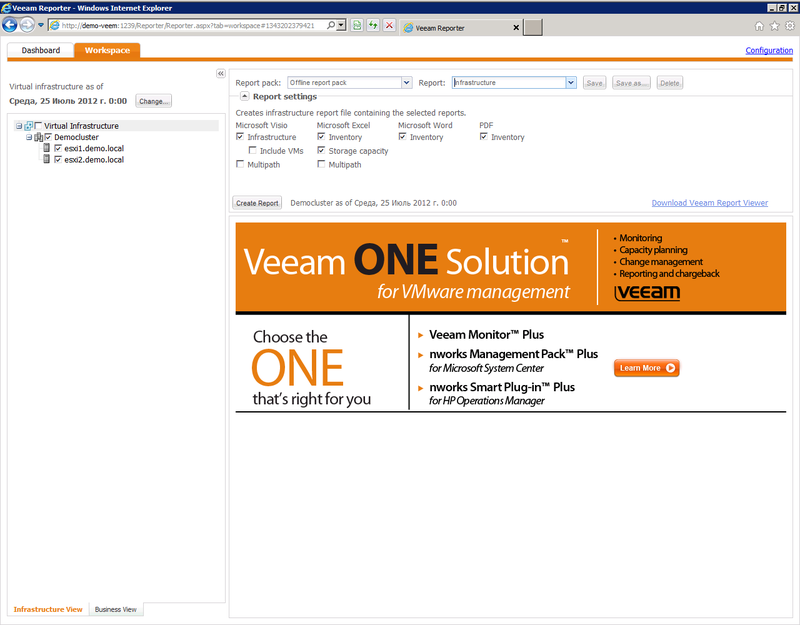
Veeam reporter report configuration window
There are only two tabs in Reporter - Dashboard and Workspace. Dashboard allows you to pull out one set of data in a graphical form (charts, graphs, etc.), that is, it is needed for a visual display of the data of interest to us. Workspace is a report editor that can be created in Visio, Excel, Word, pdf, html format. The free version of the editor is limited to several reports (entirely on infrastructure, on storage). However, the restriction does not apply to Dashboard - here you can get graphs on the state of the entire cluster as a whole, any individual virtual machines, storage systems, etc., but only 1 of the graphs can be displayed at a time.
The system allows not only viewing reports, but also setting up periodic file generation and sending by e-mail (in the free version, data is available only for the last 7 days).
Veeam Business View
Section Business View is intended for arbitrary user grouping of virtual infrastructure objects.

Business View Window
The interface consists of 6 tabs and a link with the speaker called Configuration. The first tab is again Dashboard (but the data output to it in the free version is limited to data on the state of the entire cluster as a whole, to any individual virtual machines and storage systems). The remaining tabs also allow you to display graphics by the number of processors, RAM, storage space in different groups. There is also a Workspace tab that helps to make cataloging on the selected criteria. To do this, just select the necessary items and click on the Edit Category button.
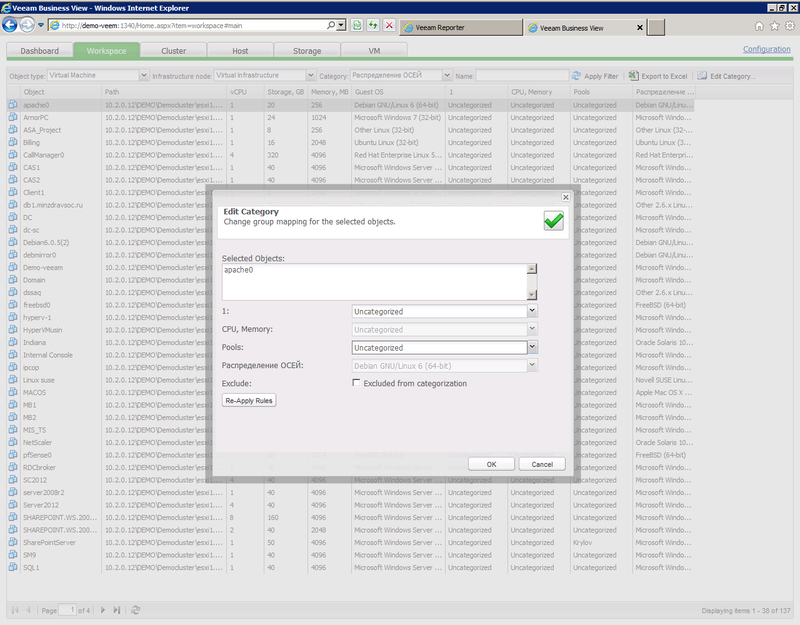
Example of adding a virtual machine to a category
The categories themselves are created in the Configuration menu, in the same place it is possible in these categories to combine elements into groups (and again we can divide the category into groups with different criteria). For example, if we need to group virtual machines by the type of operating system installed.
After making any changes, you can immediately view them by opening the Veeam Monitor and selecting the view in the lower left corner. By pointing the cursor to a folder, we will receive data by category (group) as a whole, if we expand it, we will see data on individual virtual machines, storages, etc.

Business view - grouping virtual machines by OS
Something like a conclusion
This set of programs left a very pleasant impression: reports with vivid graphs and charts, viewing updated data in real time both for individual virtual machines and by groups, obtaining statistical data on the use of resources for groups formed by various criteria. Even the free version allows you to organize a normal monitoring with e-mail notification, a visual representation of the data on all elements of the cluster (both for individual elements and in general).
Unfortunately, the backup-server's iron resources were clearly not enough for fast software operation, but by connecting an additional single-core processor (altogether there were two Xeon e5640s - yes, the backup-server is also a virtual machine, but it is not physically part of this cluster) and having increased the amount of RAM from 2 to 4 GB, we completely got rid of slowing down the shells of the program.
There are, of course, limitations in the free version, which do not allow us to fully use all the data for the entire duration of the cluster, but this is why licenses were invented.
Ttalin
Systems Engineer DEPO Computers
Source: https://habr.com/ru/post/150350/
All Articles