Monitoring PHP Code Performance with Pinba
 Let's imagine a typical start-up that is gaining popularity, using, for example, PHP or Python. At first everything is on one server - PHP (or Python), Apache, MySQL. Then you bring MySQL to a separate server, install nginx to distribute content, maybe add memcached for caching and some more application servers ...
Over time, the number of servers will grow, and sooner or later you will ask yourself questions
“What is happening with the system now? How often does one script or another run and for how long? What operations take up most of the time? ”Zabbix type monitoring systems provide only a general, superficial picture of the application state.
To get answers to these questions, a real-time monitoring and statistics service, Pinba, was developed at Badoo. In this article we will tell about our experience of using it for monitoring and profiling our system.
A few words about badoo
To assess the level of complexity of the problem, we will describe in a few words what Badoo is. Today we have 2 data centers, one in America, the second in Europe. The data centers have hundreds of PHP servers, MySQL servers, dozens of memcached and self-written services written in C / C ++. Inside Badoo, there are subprojects (for example, a website, applications for mobile devices and desktops), the implementation and nature of the loads on which vary greatly. In a single PHP request, interactions can occur with dozens of different data sources (database, cache, service). This is bad for productivity, but it is necessary for solving business problems. And in addition to this, we post a new code from 2 to 5 times a week. Monitoring the performance of such a system is not an easy task. Pinba helped to solve a large amount of problems associated with monitoring the performance of PHP scripts. This service collects information about all processed PHP requests and generates detailed reports on this data.
')
How it all works
At Habrahabr, there was already an article about how to start working with Pinba: " Pinba - monitor php in real time ." In it, the author described how to install and configure Pinba, so now we will focus on more interesting things: how it all works and what information can be obtained.
The general scheme of working with Pinba is shown in the diagram:
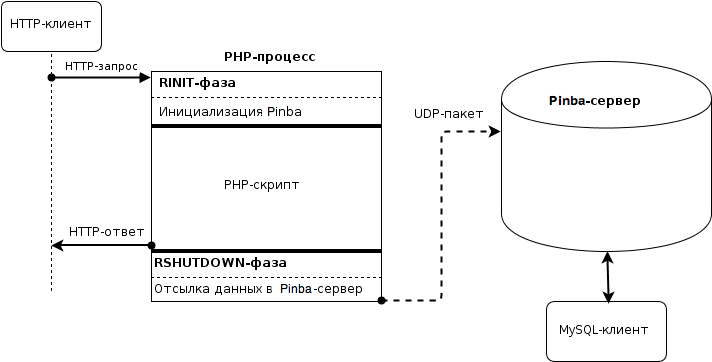
Pinba consists of a PHP module ( PHP extension ) and a server. Pinba module automatically sends data on all processed requests to the server. Pinba server is a service written in C, which:
- collects data about processed requests via UDP;
- keeps all this data in memory and builds reports on it;
- provides access to raw data and reports using the MySQL protocol, that is, in fact, is a MySQL engine.
To find out what is happening with the system at the moment, it is enough to connect to the server with any MySQL client and make a few queries from the table-reports. For example, you can view statistics on requests for each of the PHP scripts (one of the most used reports in Pinba):
mysql> SELECT * FROM report_by_script_name; Below we describe in more detail how to work with reports in Pinba.
How the PHP module for Pinba works
Even at the planning stage of the first version of the Pinba service, an idea immediately emerged of organizing the collection of general statistics without making changes to the PHP code. People who have experience writing PHP modules know that the latter have the ability to perform certain actions before each request (phase PHP_RINIT) and after processing it (phase PHP_RSHUTDOWN). For example, in the PHP_RINIT phase, the module can initialize its internal resources, and in RSHUTDOWN, it can free them. The PHP module for Pinba uses both of these phases. In RINIT, it is initialized, in RSHUTDOWN it calculates how much resources have been spent on processing the request, and then all data is sent by the UDP packet to the Pinba server.
Sending a UDP packet to C is fast enough, so the Pinba module does not add extra workload to the PHP process. And due to the fact that Pinba works as a module, it is enough to install and configure it, and you can immediately find out such parameters of your system as the number of requests for each of the scripts, the average running time without making changes to the PHP code. and much more.
Unfortunately, if you have a complex system, general parameters will not be enough.
Timers
Initially, in the first version of Pinba (let's call it Pinba v0.1) there were no timers. This version could tell us how often a script is called, what is the average response time, what is the average response size in bytes, and so on. It was impossible to find out the frequency of requests to MySQL, memcached or other services. This may not seem so critical to you, but in our system, in addition to MySQL and memcached, about a dozen different services written in C / C ++ are used.
If there was a problem in the system (for example, something started to “slow down”), then Pinba v0.1 showed us that there is a problem, but it was not always possible to quickly understand what exactly it is. Most often, in such situations, one of the services to which PHP made requests (MySQL, memcached, and others) was guilty.
To learn how to find such problem areas quickly, timers were introduced in the next version of Pinba.
In fact, we decided to measure the running time of the mysql_connect / mysql_query / memcache_connect, etc. calls, send this time to the Pinba-server and build reports on timers. On pseudo-php code, it looks like this:
pinba_timer_start(array('type'=>'db::connect', 'host'=>'users.sql')); $conn = mysql_connect(...); pinba_timer_stop(); Here we measure the running time of the mysql_connect call and assign 2 tags to the timer, after which we will be able to build reports.
All timers along with all the data are sent to the Pinba-server and reporting tables are built on it. This allows you to see which operations take the most time at the moment. Moreover, if you have, for example, hundreds of MySQL-servers and only one of them slows down, Pinba makes it easy to calculate the very problematic server due to a very flexible report schedule by timers.
Getting started with tables
Here is a list of tables Pinba gives access to:
mysql> SHOW TABLES FROM pinba; +--------------------------------------+ | Tables_in_pinba | +--------------------------------------+ | info | | report_by_hostname | | report_by_hostname_and_script | | report_by_hostname_and_server | | report_by_hostname_server_and_script | | report_by_script_name | | report_by_server_and_script | | report_by_server_name | | report_by_status | | request | | tag | | timer | | timertag | +--------------------------------------+ 13 rows in set (0.00 sec) Conventionally, all tables can be divided into 2 types: tables with “raw” data and reports.
There are 4 tables with raw data: request, tag, timer, timertag. These tables contain an entry for each invocation of a script, timer, and tag in the last few minutes. In high-load systems, these tables may contain millions of records, so we do not recommend using them directly. Instead, it is better to use tables-reports that contain enough useful data for analyzing system performance.
Report Tables
Report_by_script_name is one of the most used reports; contains information about how often each script was called, its average execution time, its use of CPU, the amount of traffic attributed to it.
mysql> DESC report_by_script_name; +------------------+--------------+------+-----+---------+-------+ | Field | Type | Null | Key | Default | Extra | +------------------+--------------+------+-----+---------+-------+ | req_count | int(11) | YES | | NULL | | | req_per_sec | float | YES | | NULL | | | req_time_total | float | YES | | NULL | | | req_time_percent | float | YES | | NULL | | | req_time_per_sec | float | YES | | NULL | | | ru_utime_total | float | YES | | NULL | | | ru_utime_percent | float | YES | | NULL | | | ru_utime_per_sec | float | YES | | NULL | | | ru_stime_total | float | YES | | NULL | | | ru_stime_percent | float | YES | | NULL | | | ru_stime_per_sec | float | YES | | NULL | | | traffic_total | float | YES | | NULL | | | traffic_percent | float | YES | | NULL | | | traffic_per_sec | float | YES | | NULL | | | script_name | varchar(128) | YES | | NULL | | +------------------+--------------+------+-----+---------+-------+ 15 rows in set (0.00 sec) The fields with the suffix _total are the sum of the corresponding values for all requests in the last 5 minutes. That is, for example, req_time_total is the sum of the execution time of all queries for the corresponding script in the last 5 minutes. And req_time_total / req_count is the average execution time of the script. The req_utime_ * and req_stime_ * fields show the CPU usage in user mode and system mode, respectively.
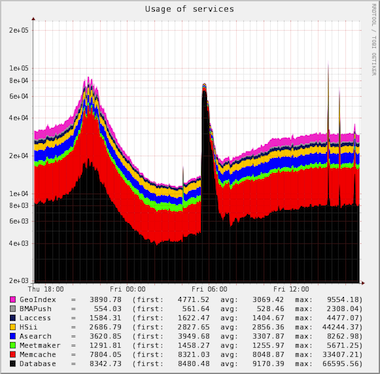
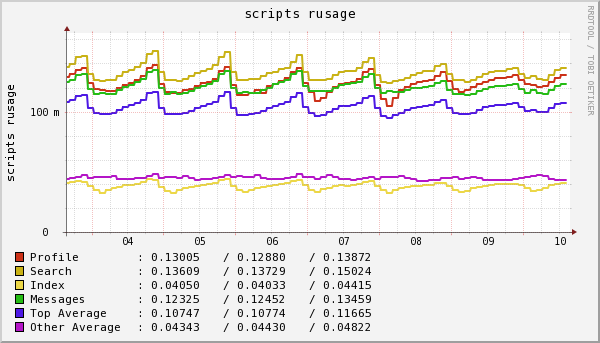
In our company, using these data, we build graphs of the number of requests for a particular script and graphics of CPU consumption by scripts (graphics 1, 2):
Chart 1.

Chart 2.
Report_by_hostname : this report shows how many requests go to a specific server. It has almost the same list of fields, but instead of the script_name field, the table contains the hostname field.
mysql> DESC report_by_hostname; +------------------+-------------+------+-----+---------+-------+ | Field | Type | Null | Key | Default | Extra | +------------------+-------------+------+-----+---------+-------+ | req_count | int(11) | YES | | NULL | | ......... | hostname | varchar(32) | YES | | NULL | | +------------------+-------------+------+-----+---------+-------+ 15 rows in set (0.00 sec) Probably, some expected to see the domain in the hostname variable passed in the HTTP Host header. But in reality, the hostname is the contents of the $ _ENV ['HOSTNAME'] variable and contains the name of the machine.
The main point of this report is to get information about the number of requests to a specific server and whether more servers go to any servers than to the neighboring ones.
Report_by_server_name : in this report, the data is grouped by the domain to which the request came. It shows the number of requests going to a particular domain. The table structure is the same as in the previous two, only the data is now grouped by the server_name field.
Report_by_status : this report is used to view HTTP statuses with which our scripts are completed:
mysql> SELECT req_count, status FROM report_by_status; +-----------+--------+ | req_count | status | +-----------+--------+ | 540622 | 200 | | 2578 | 301 | | 21955 | 302 | | 296 | 403 | | 2090 | 404 | +-----------+--------+ 5 rows in set (0.14 sec) If the report has a status of 500, it means that we have “Fatal error” somewhere in the PHP code.
Timers and tags
The reports discussed above are useful for general system analysis. But for more detailed analysis, we use timers and tags.
The timer is the time of execution of some part of the code. Several tags can be attached to the timer. The tag has a key and a value. For example, in the timer code that was shown above,
pinba_timer_start(array('group'=>'db::connect', 'host'=>'users.sql')); $conn = mysql_connect(...); pinba_timer_stop(); we measure the execution time of the mysql_connect function and bind 2 tags - group and host.
By default, Pinba has no reports on timers and tags, but it provides very flexible options for creating them. Below we take a closer look at how this is done in Badoo.
First of all, we use timers to get statistics of requests to various data sources: MySQL, memcached, services written in C / C ++. We “wrapped” all such requests with Pinba-timers with two tags: group and host (host is the address of the database or service, group is an operation on the service).
So, if we have implemented a tag in our system that is sent to Pinba, we can build several reports. First of all, it will be a complete report on all values of the tag. In our example with the group tag, we can build a report on how often this or that operation is called and how much time (total) it takes. To do this, create a table:
CREATE TABLE `tag_info_group` ( `tag_value` varchar(64) DEFAULT NULL, `req_count` int(11) DEFAULT NULL, `req_per_sec` float DEFAULT NULL, `hit_count` int(11) DEFAULT NULL, `hit_per_sec` float DEFAULT NULL, `timer_value` float DEFAULT NULL ) ENGINE=PINBA DEFAULT CHARSET=latin1 COMMENT='tag_info:group' The table name is arbitrary and does not affect anything. It is important that the order of the fields be exactly the same as in the example, as well as the values for ENGINE and COMMENT = 'tag_info: group'. In the comment group is the name of the tag for which we are creating a report. And tag_info is a type of report (there is also tag_report, which will be discussed below).
After creating the table, Pinba will automatically begin to enter data there. This report will look something like this:
mysql> SELECT * FROM tag_info_group ORDER BY timer_value; +--------------------+-----------+-------------+-----------+-------------+-------------+ | tag_value | req_count | req_per_sec | hit_count | hit_per_sec | timer_value | +--------------------+-----------+-------------+-----------+-------------+-------------+ | curl_request | 56216 | 281.08 | 56710 | 283.55 | 11977.3 | | memcache_get | 2563499 | 12817.5 | 11462991 | 57315 | 6823.04 | | hsc_connect | 2319186 | 11595.9 | 2870366 | 14351.8 | 6140.5 | | hsc_open_index | 2319158 | 11595.8 | 3285335 | 16426.7 | 5805.61 | | hsc_select | 2312567 | 11562.8 | 3158465 | 15792.3 | 5778.57 | | memcache_connect | 2563064 | 12815.3 | 4007451 | 20037.3 | 2389.65 | | memcache_set | 917102 | 4585.51 | 1616016 | 8080.08 | 1059.08 | | memcache_delete | 600720 | 3003.6 | 2451872 | 12259.4 | 785.702 | | scribe_receive | 382881 | 1914.41 | 975892 | 4879.46 | 382.522 | | hsc_update | 84877 | 424.385 | 85287 | 426.435 | 317.637 | | hsc_insert | 41564 | 207.82 | 41574 | 207.87 | 280.468 | | scribe_send | 382894 | 1914.47 | 975892 | 4879.46 | 174.156 | | memcache_increment | 60817 | 304.085 | 88734 | 443.67 | 30.9102 | | memcache_add | 14818 | 74.09 | 16281 | 81.405 | 4.71686 | | memcache_multi_get | 2543 | 12.715 | 2543 | 12.715 | 1.59621 | | hsc_delete | 4 | 0.02 | 9 | 0.045 | 0.003373 | +--------------------+-----------+-------------+-----------+-------------+-------------+ 16 rows in set (0.00 sec) For example, from this report it is clear that we have some very slow curl_request .
Reports like tag_info give an overall picture of its use in the system. To study in more detail where these or other operations are called from, you need to build the same report, but grouped by the script name. To do this in Pinba you need to create the following table:
CREATE TABLE `tag_report_group` ( `script_name` varchar(128) DEFAULT NULL, `tag_value` varchar(64) DEFAULT NULL, `req_count` int(11) DEFAULT NULL, `req_per_sec` float DEFAULT NULL, `hit_count` int(11) DEFAULT NULL, `hit_per_sec` float DEFAULT NULL, `timer_value` float DEFAULT NULL ) ENGINE=PINBA DEFAULT CHARSET=latin1 COMMENT='tag_report:group' The table structure is in many ways similar to the previous tag_info_group report. Notice that the script_name field appeared , and in the COMMENT field we created a report like tag_report . From this table we can get all the same data as from the previous one, but grouped by script_name .
You can see what operations are performed in a particular script:
mysql> SELECT tag_value, req_count, hit_count, timer_value, hit_count/req_count FROM tag_report_group WHERE script_name='/admin/messages/all.phtml' ORDER BY timer_value DESC; +--------------------+-----------+-----------+-------------+---------------------+ | tag_value | req_count | hit_count | timer_value | hit_count/req_count | +--------------------+-----------+-----------+-------------+---------------------+ | memcache_get | 107439 | 3227537 | 1060.68 | 30.0406 | | memcache_connect | 107439 | 887789 | 270.919 | 8.2632 | | scribe_receive | 107573 | 283478 | 68.9106 | 2.6352 | | memcache_set | 34339 | 153080 | 50.6079 | 4.4579 | | scribe_send | 107573 | 283478 | 39.7583 | 2.6352 | | memcache_delete | 18236 | 21306 | 4.54436 | 1.1683 | | curl_request | 15 | 15 | 0.514396 | 1.0000 | | memcache_decrement | 1250 | 1250 | 0.251141 | 1.0000 | | memcache_multi_get | 125 | 125 | 0.066473 | 1.0000 | | memcache_increment | 2 | 2 | 0.000336 | 1.0000 | +--------------------+-----------+-----------+-------------+---------------------+ 10 rows in set (0.03 sec) This example shows the difference between the hit_count and req_count fields . Req_count is the number of HTTP requests during the processing of which a timer with the specified tag_value was called at least once. Hit_count - the number of times the timer was called with the specified tag_value.
In the example above, you can see that in our /admin/messages/all.phtml script, on average, 30 times, memcache_get is called. Most likely this is a programmer's error, and the page needs to be optimized.
If you have many database servers, memcached and other services, then there may be times when only one server “slows down”. And his “inhibition” against the general background may not be obvious. For this purpose, we made another tag called server . For it, you can create a general report tag_info: server and see the overall statistics for each host. Here is an example of data for memcached statistics:
mysql> SELECT * FROM tag_info_server WHERE tag_value LIKE 'memcache%' ORDER BY timer_value; +------------------+-----------+-------------+-----------+-------------+-------------+ | tag_value | req_count | req_per_sec | hit_count | hit_per_sec | timer_value | +------------------+-----------+-------------+-----------+-------------+-------------+ | memcached7.mlan | 350702 | 1753.51 | 1767513 | 8837.57 | 781.644 | | memcached3.mlan | 336217 | 1681.08 | 1734430 | 8672.15 | 871.633 | | memcached1.mlan | 350082 | 1750.41 | 1823910 | 9119.55 | 883.52 | | memcached8.mlan | 357798 | 1788.99 | 1793808 | 8969.04 | 908.848 | | memcached10.mlan | 343287 | 1716.44 | 1757085 | 8785.42 | 909.042 | | memcached5.mlan | 398042 | 1990.21 | 1861729 | 9308.64 | 914.772 | | memcached4.mlan | 401584 | 2007.92 | 1877775 | 9388.88 | 937.53 | | memcached2.mlan | 459912 | 2299.56 | 2028406 | 10142 | 971.189 | | memcached6.mlan | 399768 | 1998.84 | 1912571 | 9562.86 | 975.094 | | memcached9.mlan | 425276 | 2126.38 | 1939575 | 9697.88 | 1008.29 | +------------------+-----------+-------------+-----------+-------------+-------------+ 10 rows in set (0.00 sec) The general report on the host tag is not informative enough. It shows the frequency of calling timers with a particular host, but without information about the operations performed. Fortunately, Pinba is able to create reports like tag_info and tag_report grouped by 2 tags:
CREATE TABLE `tag_info_group_server` ( `group_value` varchar(64) DEFAULT NULL, `server_value` varchar(64) DEFAULT NULL, `req_count` int(11) DEFAULT NULL, `req_per_sec` float DEFAULT NULL, `hit_count` int(11) DEFAULT NULL, `hit_per_sec` float DEFAULT NULL, `timer_value` float DEFAULT NULL ) ENGINE=PINBA DEFAULT CHARSET=latin1 COMMENT='tag2_info:group,server' This report allows you to get statistics on the operations of each host. For example, you can see the statistics of operations on a particular host:
mysql> SELECT * FROM tag_info_group_server WHERE server_value = 'dbs101.mlan' ORDER BY timer_value; +-------------+--------------+-----------+-------------+-----------+-------------+-------------+ | group_value | server_value | req_count | req_per_sec | hit_count | hit_per_sec | timer_value | +-------------+--------------+-----------+-------------+-----------+-------------+-------------+ | db::replace | dbs101.mlan | 154 | 0.77 | 154 | 0.77 | 0.257526 | | db::delete | dbs101.mlan | 1340 | 6.7 | 1340 | 6.7 | 1.84398 | | db::begin | dbs101.mlan | 6437 | 32.185 | 6589 | 32.945 | 2.96375 | | db::commit | dbs101.mlan | 6437 | 32.185 | 6589 | 32.945 | 3.04067 | | db::insert | dbs101.mlan | 4674 | 23.37 | 11171 | 55.855 | 13.9457 | | db::update | dbs101.mlan | 6358 | 31.79 | 10399 | 51.995 | 18.197 | | db::connect | dbs101.mlan | 16826 | 84.13 | 16826 | 84.13 | 22.1383 | | db::select | dbs101.mlan | 14372 | 71.86 | 47106 | 235.53 | 180.235 | +-------------+--------------+-----------+-------------+-----------+-------------+-------------+ 8 rows in set (0.01 sec) For obvious reasons, it is SELECT that takes most of the time.
Also, for example, you can compare statistics for the same operation on different hosts. Example for memcache_connect:
mysql> SELECT server_value, req_count, hit_count, timer_value FROM tag_info_group_server WHERE group_value='memcache_connect' ORDER BY timer_value; +------------------+-----------+-----------+-------------+ | server_value | req_count | hit_count | timer_value | +------------------+-----------+-----------+-------------+ | memcached1.mlan | 366138 | 365061 | 191.808 | | memcached3.mlan | 354688 | 353760 | 192.184 | | memcached10.mlan | 365358 | 364341 | 197.353 | | memcached8.mlan | 368912 | 367839 | 213.768 | | memcached7.mlan | 374160 | 373152 | 215.914 | | memcached5.mlan | 415444 | 414434 | 217.855 | | memcached4.mlan | 423394 | 422242 | 252.416 | | memcached2.mlan | 478949 | 477641 | 272.346 | | memcached6.mlan | 414088 | 413003 | 279.038 | | memcached9.mlan | 441589 | 440481 | 377.952 | +------------------+-----------+-----------+-------------+ 10 rows in set (0.01 sec) You can also make a report like tag2_report , in which the information on 2 tags is divided into scripts:
CREATE TABLE `tag_report_group_server` ( `sc0ript_name` varchar(128) DEFAULT NULL, `tag1_value` varchar(64) DEFAULT NULL, `tag2_value` varchar(64) DEFAULT NULL, `req_count` int(11) DEFAULT NULL, `req_per_sec` float DEFAULT NULL, `hit_count` int(11) DEFAULT NULL, `hit_per_sec` float DEFAULT NULL, `timer_value` float DEFAULT NULL ) ENGINE=PINBA DEFAULT CHARSET=latin1 COMMENT='tag2_report:group,server' We give an example where this table can be useful. In our system, all users are distributed among hundreds of MySQL servers. This is called "sharding." There are also certain central MySQL servers for specific tasks. In theory, all web scripts should only make requests for “shards” and not make requests to central databases. The hostname of our shards starts with dbs * or dbb *. You can check if there are any scripts that make connections to other MySQL servers using this query:
mysql> SELECT * FROM tag_report_group_server WHERE tag1_value='db::connect' AND tag2_value NOT LIKE 'dbs%' AND tag2_value NOT LIKE 'dbb%'; It will show which scripts make requests to central databases.
nginx + Pinba
But even this was not enough for us. When a client sends us an HTTP request, the latter first gets into nginx and then proxied to PHP. What happens if the PHP process at this point cannot accept and process the request? For example, if the server is overloaded, or due to network problems, will nginx not be able to communicate with the php-fpm process? The user in this case will see an error, and we in PHP will not know about it (though it will be in the nginx logs).
In order to have an idea of what answers (which HTTP statuses) we return to the client, Pinba developer Anton Dovgal made a module for nginx . The module for nginx works the same as the PHP module, but for obvious reasons it does not have timers. The most useful reports he makes are report_by_script_and_status and report_by_status .
Plotting
Pinba stores data for the last few minutes. This time can be changed in the settings . But this is not enough if you want to monitor how the system performance changes over time. To do this, you need to store the data of the Pinba reports (not necessarily all) for a long time and build graphs on them. Thus, you can observe the dynamics of changes in the load on the system and on its individual scripts, as well as track how your PHP code loads databases, memcached and other data sources.
Pinba does not know how to build graphs and store data for a long period. To do this, use separate utilities. You can configure Zabbix to monitor Pinba and build graphs for some of its values. You can use a ring (cyclic) database type RRDtool or Graphite. In our company we use RRDtool.
RRDtool does not describe in two words. He has many nuances of his own, and different people have different preferences in charting, so this topic is worthy of a separate article. There are already enough manuals on the Internet that will help you to start working from scratch with this set of utilities.
results
What did Pinba give us? Most of the performance problems began to be detected much faster than before its implementation. If a script has become much more frequently requested by users, it can easily be found in Pinba. If suddenly some of the services (MySQL, memcached, etc.) become slower to work, then with the right reports in Pinba, you can easily localize this service. And if he began to "slow down" because of the high frequency of the request, then thanks to Pinba, it is sometimes possible to localize scripts, often requesting a specific problem service.
It is very useful to watch Pinba charts after laying out a new version of the code on the server. You can see how the load on the system has changed. But for this it is important to think about what graphics will be built.
However, you should not take Pinba as a replacement for full server monitoring. We, for example, use Zabbix to monitor the consumption of CPU, memory, disks and network activity on all servers. On the other hand, there is Pinba with graphs in the RRD. Comparing the graphs from these two systems, you can easily calculate the “cost” of a PHP request and estimate how many requests per second your servers can handle. And this, in turn, allows you to plan whether new server purchases are needed in the near future or whether there is room for code optimization.
Apart from the PHP module, Pinba is not tied to PHP and can be used to monitor systems written in other languages. GitHub already has projects for using Pinba in Python and Ruby.
Maxim max_m Matyukhin, developer
Badoo company
useful links
- Official Pinba Project Page
- Pinba Engine development list - English-language Google-group for discussion Pinba
- Pinba Engine development list (in Russian) — Google- Pinba
- Pinba — php — Pinba
- RRDtool
- Graphite
- — wikipedia.org
- Nginx module for pinba
- Python WSGI middleware for pinba
Source: https://habr.com/ru/post/149695/
All Articles