Things I didn't know about WebKit inspector
After reading the article jtaby.com/2012/04/23/modern-web-development-part-1.html I learned a few useful things, I will write here I will not forget.
You can move any HTML element on the page, thereby changing its position relative to other elements. This allows you to do funny things, for example:

')
Select an item in the Elements panel and type
Right click on the element in the Elements panel and select Break on Subtree Modifications : every time the children of this element change, the debugger will automatically give you the opportunity to find out what happened:

Immediately after the Styles header, there are two super useful buttons: one allows you to add a new CSS property for any element. The second allows you to see the state of the element in several states, so you can see how the element looks in the active state when the cursor is over it, in focus ..
Click on the name of the modified CSS file located in the Sources panel. From here you can save it. This trick does not work for new selectors that were added using the
A line break is done using the Shift + Enter key combination. Normally pressing Enter executes the script.
Ctrl + L.
Click on the button
Command + O (for Windows and Linux — Ctrl + O ) shows a list of all available files. Command + Shift + O shows the list of all functions (classes) of the current file. Command + L allows you to go to a specific line:
If you have to check the same expression or variable several times during debugging, add them to the Watch Expression list. Now you can follow them while the code is being executed:
From the XHR Breakpoints section in the debugger, you can specify any URL (or part of the link) and if the XHR request is executed that meets your requirements, the script will stop at the point of sending the XHR request. Or you can follow any XHR:
Suppose your co-worker found a problem and instead of showing you a screenshot, he can save events, and you can load them locally.
Drag and Drop in the Elements panel
You can move any HTML element on the page, thereby changing its position relative to other elements. This allows you to do funny things, for example:
')
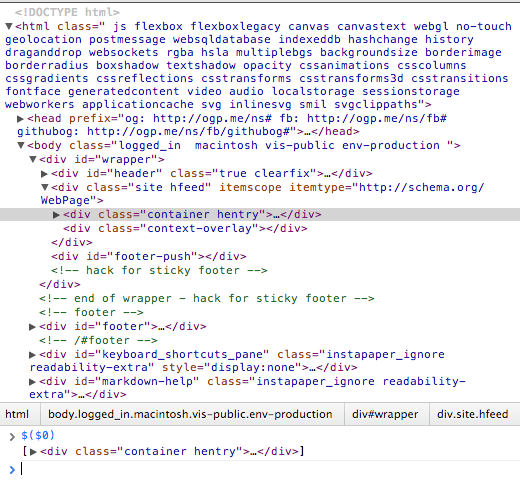
Quick links to items from the console
Select an item in the Elements panel and type
$0 in the console. If you are using jQuery, you can type $($0) , thereby getting the jQuery selector:Note:$0is the current selected item,$1is the previous selected item, etc.
DOM Change Debugger
Right click on the element in the Elements panel and select Break on Subtree Modifications : every time the children of this element change, the debugger will automatically give you the opportunity to find out what happened:
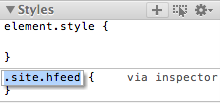
Style buttons
Immediately after the Styles header, there are two super useful buttons: one allows you to add a new CSS property for any element. The second allows you to see the state of the element in several states, so you can see how the element looks in the active state when the cursor is over it, in focus ..
Saving an edited CSS file with the inspector
Click on the name of the modified CSS file located in the Sources panel. From here you can save it. This trick does not work for new selectors that were added using the
+ button or added inside element.style , it will only work for modified properties that previously existed.Console - write commands in several lines
A line break is done using the Shift + Enter key combination. Normally pressing Enter executes the script.
Shortcut for quick console cleaning
Ctrl + L.
Tracking uncaught exceptions
Click on the button
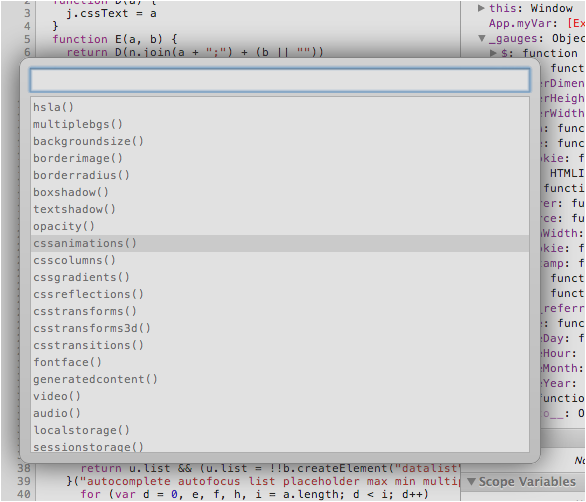
|| in the Sources pane, it will stop the execution of the script at the point where the uncaught exception occurred, saving the call stack and the current state of the application.Go to ... in the Sources panel
Command + O (for Windows and Linux — Ctrl + O ) shows a list of all available files. Command + Shift + O shows the list of all functions (classes) of the current file. Command + L allows you to go to a specific line:
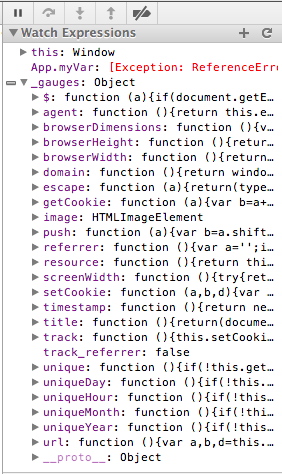
“Remember” expressions (variables):
If you have to check the same expression or variable several times during debugging, add them to the Watch Expression list. Now you can follow them while the code is being executed:
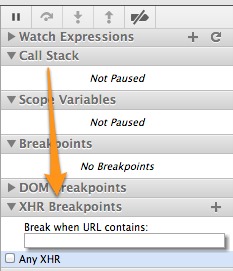
Debug XHR
From the XHR Breakpoints section in the debugger, you can specify any URL (or part of the link) and if the XHR request is executed that meets your requirements, the script will stop at the point of sending the XHR request. Or you can follow any XHR:
Loading events from the Timeline panel by another person
Suppose your co-worker found a problem and instead of showing you a screenshot, he can save events, and you can load them locally.
Source: https://habr.com/ru/post/149430/
All Articles