Prediction of the departure of loyal players in the IMO
 In the last article I described how we in Innova use data mining to predict the departure of newcomers just starting their way into Aion MMORPG based on the logs of their actions for a couple of hours or days spent in the game. But we also have veterans who have spent months and years in the game, and they also sometimes leave. We have already learned with high accuracy to predict the extinction of their interest by the same data mining methods.
Technical details
Nothing has changed from the previous article; under datamining we still have two Dual Xeon E5630 32Gb RAM blades, 10 Tb of cold storage for source and intermediate data, 3 Tb of hot storage in a RAID10 SAS array for working data. Both servers for MS SQL 2008R2 are one for the database and one for Analysis Services. The software part of the solution is Microsoft's standard Business Intelligence package included in SQL Server.
Input data - activity logs for 6 months for 38,000 enthusiastic players.
What is considered care
For beginners, the question did not even stand - a person leaves the game in a couple of minutes or hours, and in fact everything - the player is lost. On the last day, when a person entered the game, we fixed the day of care and trained our neural networks with this information. But for veterans, we went through several iterations in order to correctly determine what kind of fact should be considered care and what to predict in the end. The first assumption was the simplest: a man plays while he likes everything, and then he stops playing. Noting the days of the game on the calendar, we expected something like this:
')

Our idea was that the last game day is the point of departure that we will predict. The reality, however, turned out to be much more complex, most players behave like this:

What is considered the moment of departure - August 25, formally the last day of the game? Or, for example, the 16th, when we have not seen a person in the game for a week already? Or July 31, the first time she has not started the game for 7 days in a row? We tried different hypotheses, and the simplest did not work at all. Predict that a certain day will be the last day of the game, we managed with a sad accuracy of 65%.
With a close look at the data, we realized that most players have a long tail of game days, as shown on the last calendar card — residual activity for a couple of weeks or even months. In fact, they have already stopped playing actively , but still sometimes enter the game. For such people, the actual departure has already taken place - they are no longer happy about the game, but they go by inertia to chat with friends, sell things, or in general their accounts are already used by clan members.
The next step was cutting the tail according to the rules of thumb in order to try to get to the true day from which the activity began to fall. The most effective was the approach “the last day of the game, when the total activity over the last 30 days was less than 9 days, ” which gave an accuracy of about 80%. But the empirical approach worked poorly for loyal, but not very active players, so I had to think further.
Transition to segmentation
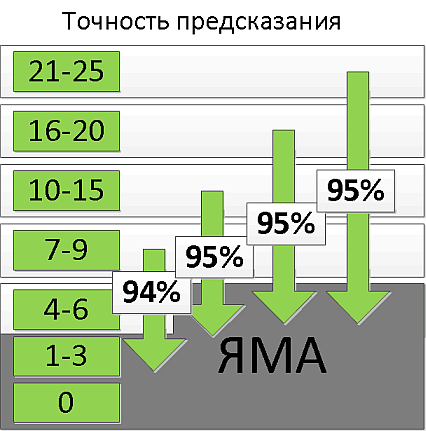
The transition from binary thinking “left / left” to the use of our already existing activity clusters was a success, from the situation “the player left our game” to “the player's activity falls below the threshold of probable leaving”. We have been using the frequency usage metric (in western literature frequency ) for a couple of years - the number of days of activity over the last 30 calendar days. Simply put, we see a person in the game every day, every other day, a couple of days a week, or even once a month. By frequency, we build activity clusters, segmenting the audience:
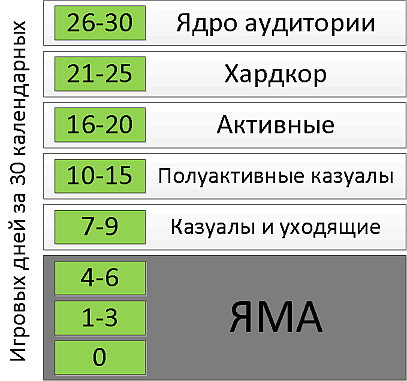
Now we will define the withdrawal as a fall into the Pit, a zone of extreme inactivity bordering on leaving the game. This redefinition is not only mathematical, but it also makes clear sense from a business point of view - instead of post-factum predicting that our player is no longer with us, we want to predict its future inactivity, a couple of weeks in advance, to have time to figure out the reasons and raising his motivation to play further.
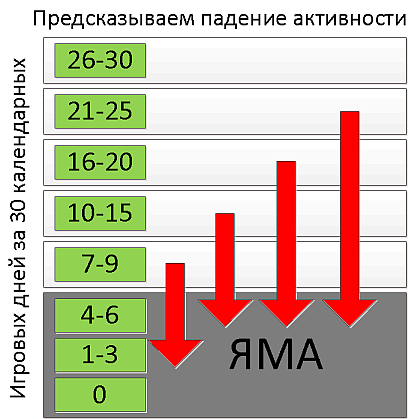
A new approach was the prediction of those players who face a fall into the Pit in two weeks, for the segments [7–9], [10–15] and [16–20], and after 3 weeks for the segment [21–25]. That is, we are looking for players who lose momentum momentum, whose activity should fall sharply over the next couple of weeks:
Metric selection
From our first data mining project, we learned how critical the metrics of overall activity for predicting exits are. It is expected that now they will play a significant role, but, nevertheless, we decided to try other, social and game-specific metrics:
- Chat activity - private messages, clan chat and general chat
- Resource gathering and crafting
- PvP and PvE instances
- The remaining days of the paid subscription
- Maximum character level
Maths
Previously, for beginners, game data was used for a day or two, so the model had instantaneous values, the maximum required was normalization of metrics. But for veterans, we look at the scale of weeks and months, so time aggregation is required - moving averages and sums, derivatives and angles of inclination.
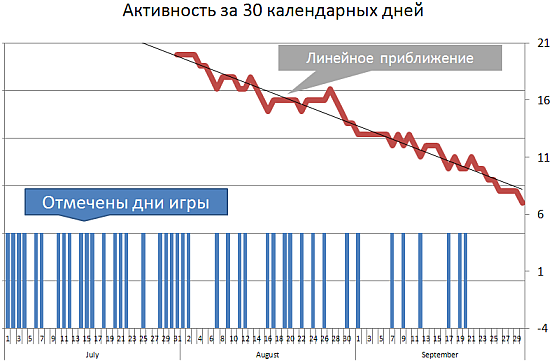
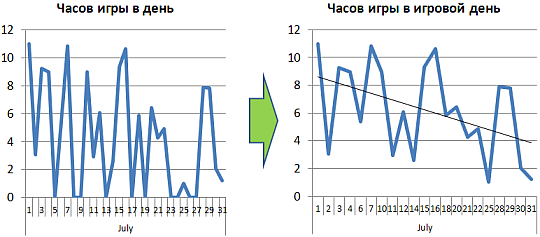
For example, we used a rolling amount of gaming days for 30 calendar days, linearly approximated by the least squares method , which is excellently counted directly in T-SQL. At the entrance to the data mining model are direct coefficients. And to analyze the daily time spent in the game, another step was added to throw out the days of inactivity:
The ETL was actually redone and all the data was reloaded, but the approach was definitely correct, the first runs were given on a cluster [16-20] on raw, manually unconfigured models with an accuracy of 80%. Having tried in the end more than 30 different metrics with different periods and methods of aggregation and counting, we came up with 80-90% accuracy of predicting the fall into the Pit for all segments of activity. Already a good result, but we wanted more. And a couple of months struggled to improve accuracy, until they came to another idea.
Back to the past
If we postpone our data on the time axis, the picture was as follows:
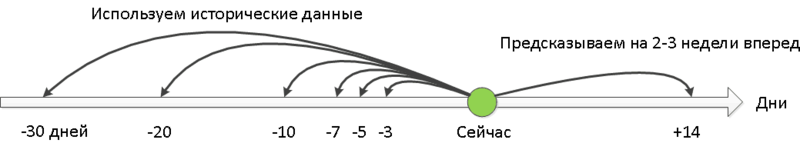
The zero point is the day in which we make a forecast for 2-3 weeks ahead (depending on the segment, as described earlier). At the entrance, the models are supplied with various metrics calculated for different periods, for example, the first derivative of the moving average playing time per game day calculated over X days . What is important: all metrics were counted from the zero point - for 3 days, 5 days, etc.
A fresh thought was to look into the past in more detail. For example, we could calculate the same derivative of the moving average playing time per game day for 7 days, but 14 days ago - two weeks before the zero point. Remember the long tail of the fading activity of the player? In fact, we invented tail dissection into its component parts and their independent analysis by datamining models. We tried several variants of the periods and depths of the past, in particular, the samples (7, -21) were effective - seven days deep 21 days ago, (7, -14), (7, -7) and (14, -14).

This idea was a breakthrough, which increased accuracy to 95% in almost all segments:
In black box
The most striking result of this project is the final data mining model, with the best results on accuracy and errors of the second kind, entirely based on various mathematical combinations and calculations from just two metrics - daily activity and playing time!
For different segments, different metrics were key in the models. For example, for [21-25] it turned out that we need absolutely all of our calculations from the detailed past. But for [7–9], approximations for 30 days along with the nearest past — data 3 and 5 days before the zero point turned out to be important. All models were based on derivatives, values at point zero, and linear approximation coefficients — everything is much more complicated than simple instantaneous values that we used when making predictions for beginners. Example of the final model (the image is clickable ):

And if you have the impression that this is some kind of black box with magic math, then we fully share this opinion, for us it is a black box . Even with the forecasts for beginners, we were surprised at how little our mining date tells us about the reasons for leaving ; we predicted the departures with high precision, but we had no idea why this was happening. But for newbies, we at least got a lot of data on their playing styles and game features used, and based on this data we made our system of individual email prompts. For veterans, we completely failed to get at least some human-readable results. It's a beautiful, 95% accurate, but completely opaque black box.
Summary
We can predict, in 2-3 weeks, strong drops in the game activity of our loyal players, which will allow our community managers to take care of such players, find out the reasons and do something to increase their interest in the game.
This data mining project turned out to be much more complicated than the predictions for beginners . More time was spent on experiments and fine tuning, but in the end, the 95% accuracy threshold was reached. The most interesting thing is that in general, no specific metrics for Aion were included in the final models. Forecasting is based solely on derived metrics from daily activity and time spent in the game , applicable not only for any game, but, I am sure, for any web service.
Source: https://habr.com/ru/post/149405/
All Articles