Business analysis in the social network Odnoklassniki

This post is about statistics systems in Odnoklassniki. It will talk about why we need statistics, and what systems we have to work with it. In the following posts we will describe in detail:
• systems architecture;
• main components of systems and algorithms;
• non-trivial problems and solutions
')
Why do we need statistics?
We need statistics in order to know everything about the work of our site. This knowledge allows us to:
• to develop services not at random, but to purposefully improve the performance of the site and user activity;
• evaluate the success of any development, be it a new service or the simplest refactoring of code;
• track the work of the site as a whole;
• to control the work of each of the site components and their interrelation;
• investigate anomalies in the work of individual components of the site;
• investigate abnormal changes in user activity;
• analyze the target audience of our services.
What kind of data we collect
To really know everything about the work of our site, you need to collect a lot of information. Every day we process more than two trillion (2,000,000,000,000) records. Interested parties can access the processed statistics with a delay of 2-3 minutes, that is, almost in real time.
We log:
• any user activity (any click);
• any call to any non-trivial component of the site (for example, java-class and method);
• any interrelationships of the site components (for example, a cache server accessing the web server).
Also, we upload data on user content (for example, uploaded photos and ratings) and activity (for example, logins or visits) to the statistics system in order to analyze user behavior in detail.
Tools for working with statistics
System of graphs and deshbordov
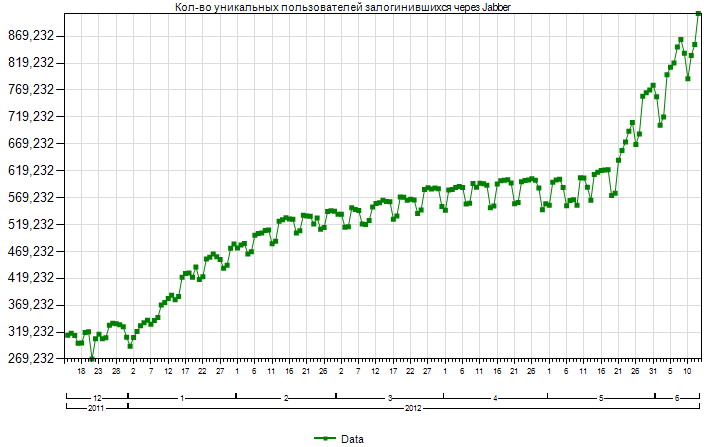
Statistics we look at mainly in the form of graphs. These charts most often come in two forms:
1) a graph where one point is aggregated data for five minutes. These are schedules for operational monitoring.
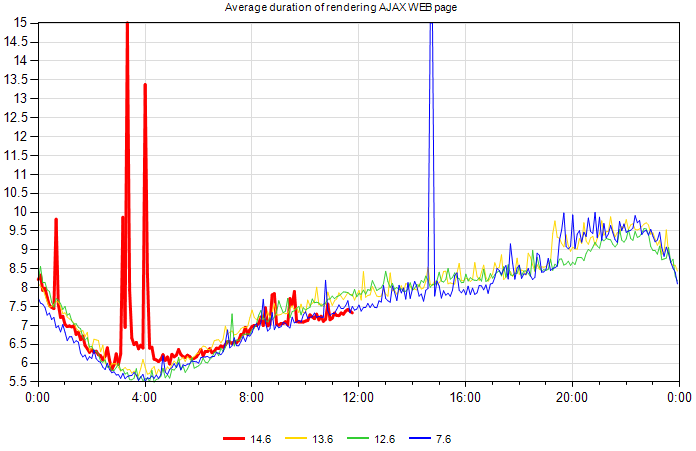
2) a graph where one point is aggregated data for at least one day. You can also specify other periods - week, month, quarter and year. These are charts for tracking long-term trends.
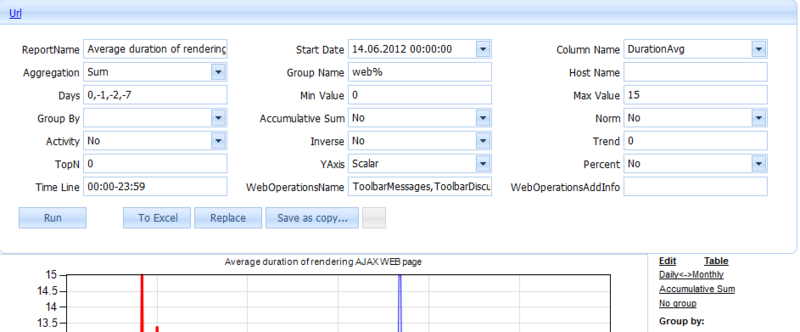
With a single click, any graph is transferred online, in which you can change the parameters and filters of the graph and immediately get the result.
Main features of the graphs:
1) select any date and any period (the whole history is available);
2) select any parameter - for example, the number of calls, the average execution time;
3) group by any classifier, for example, by servers or by java-classes;
4) put any filters - by value, by list of values;
5) process mathematical algorithms - for example, smooth the schedule;
6) switch from 5-minute schedule to daily and back;
7) save the customized schedule to a deshborb as new or overwrite the old one.
Of these graphs, we make thematic deshbordy. To do this, we wrote a web application in ASP.NET.
An important aspect of this system is that they work with charts and are made by managers, developers and administrators, and not by the business analysis department. Business analysts are engaged only in providing tools and ensuring system performance.
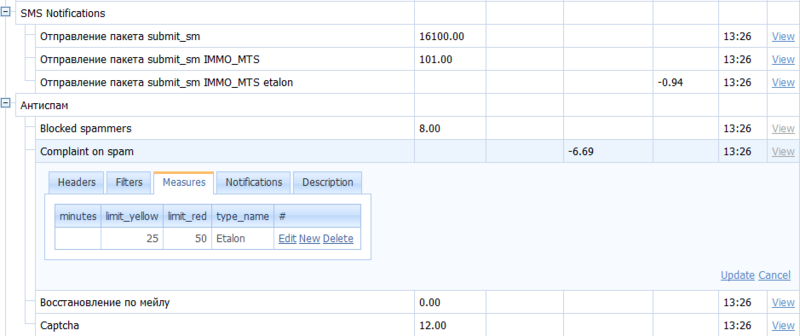
Traditional reporting system
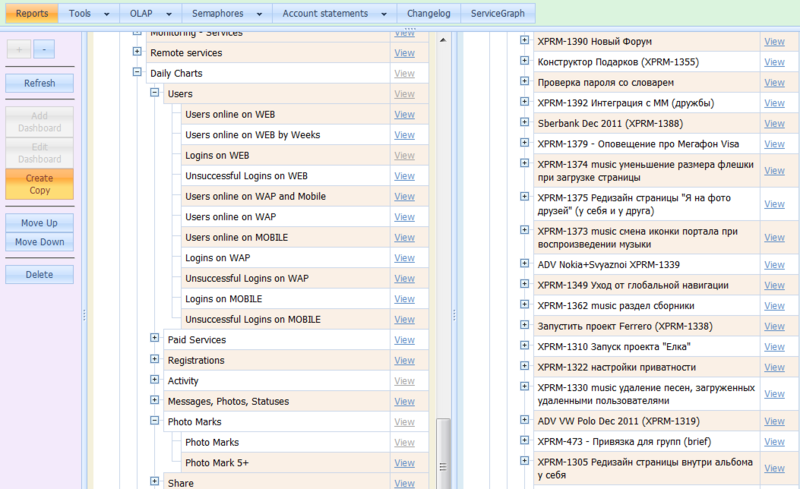
We also have traditional reporting: these are static reports that show the requested data in the form of tables or graphs. The business analysis department creates them on request. These reports are integrated into the system of graphs and dashboards.
We will not consider the reports - by themselves they are not interesting. Consider the methods of processing large amounts of data (for example, only logins in 2011, we had almost 30 billion).
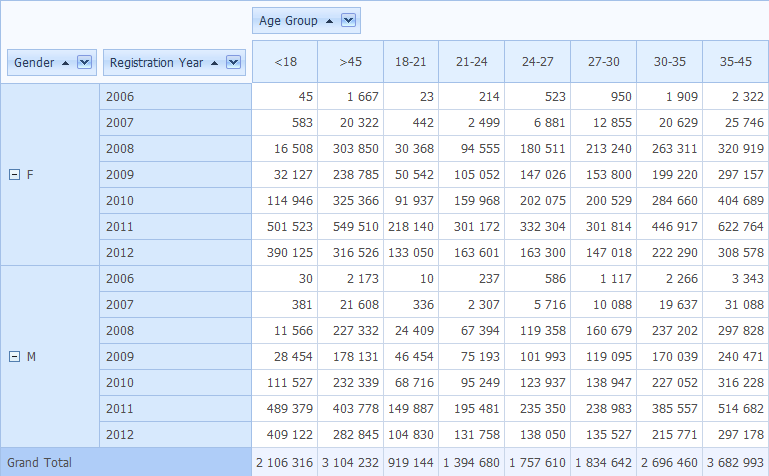
Multidimensional (OLAP) analysis system
Often it is more convenient to analyze long-term trends in the pivot-table style, where any parameter can be divided into components in the form of a table.
Therefore, we create OLAP-cubes for different topics, for example, a cube of payments, a cube of logins and others. To work with cubes, we wrote a web application.
System for automatic detection of anomalies
Viewing the dashboards with charts is not the most effective way to monitor. We have created a system that “looks through” the graphics, and, if it notices abnormal deviations from the “norm,” notifies it by letter or by SMS.
System of automatic detection of "bottlenecks" in the infrastructure
We have a fairly large fleet of equipment - more than 4,000 servers, for which we use various specialized systems - Cacti, Zabbix and others. When the use of a resource reaches a critical level, administrators are automatically notified of this.
In order for server load to reach a critical level as rarely as possible, it is necessary to regularly analyze the operational performance of these servers and make appropriate decisions, for example, on adding additional capacity. To qualitatively perform such an analysis manually is very difficult. Therefore, we have written a module that unloads data from Cacti systems into the data warehouse and sorts out operational figures for the previous couple of weeks to “how soon will we reach a critical level, if everything continues in the same vein”.

Used technologies
Data store
In 2008, when they decided to build a business analysis system, MS SQL bases were widely used at Odnoklassniki. Therefore, the logical choice for us was to use this platform for business analysis.
Today, as a data warehouse, we use only MS SQL 2008 R2 Enterprise Edition. We are planning an upgrade to MS SQL 2012. Of course, we will inform you about the results.
Data processing
We tried to use MS SQL Integrity Services, but this technology turned out to be too disadvantageous in terms of labor costs. The same code can be written in T-SQL several times faster. Therefore, 99.9% of the data processing code is written in T-SQL, and the rest is in .NET.
OLAP
For multidimensional analysis, we use MS SQL 2008 R2 Analysis Services. We are also planning an upgrade to MS SQL 2012. We wrote a web application for the front-end.
Graph and report generator
For generation of graphs and most reports we use MS SQL Reporting Services. Initially, this was a very good solution, because there it was possible to quickly build the necessary minimum functionality. But now the system requirements have grown - we need a richer, faster and more dynamic user interface. Therefore, we plan to migrate to another solution (have not yet chosen which one).
Web applications
All web applications are written in ASP.NET. We use DevExpress UI components that allow you to easily and quickly create good shapes in the same style.
In the next post, we will describe in detail how we log the information and deliver the data to DWH.
Team Odnoklassniki
Source: https://habr.com/ru/post/149391/
All Articles