Profiling JavaScript with Chrome Developer Tools
The speed of the site consists of 2 parts: how quickly the page loads and how quickly the code in it works. Many services, such as minifiers or CDN, help speed up the download, but the speed of the code depends only on you.
Small changes in code can produce huge changes in performance. Just a few lines can mean the difference between a fast site and the “Unresponsive Script” dialog.
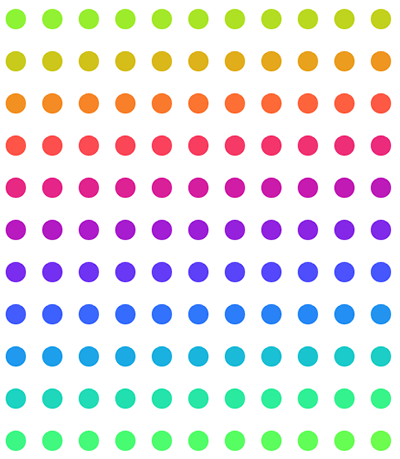
We will analyze a simple application called a color sorter, which shows a table of colors that you can drag. Each point is a div with a little CSS added to make it look like a circle.
')
The page loads quickly enough, but it still needs some time and there is a slight blink before the drawing ends. It's time to do profiling and make it faster.
Always start your performance acceleration by setting the benchmark to know how fast or slow the application is at the moment. The point of the report will give you an understanding of whether you really speed up the program and help you make compromises.
Profiler is part of the Chrome Developer Tools, which is always available in Chrome. Press Ctrl + Shift + I to launch it. Chrome still has a great event tracking utility - Speed Tracer .
To define our point of reference, let's start recording in the “Timeline” tab, load the page and stop the recording (to start recording in the open Chrome Developer Tools, go to the “Timeline” tab and in the lower left corner click the icon - black circle - “Record”). Chrome is smart enough not to start recording until the page starts loading. I ran it 3 times and calculated the average.
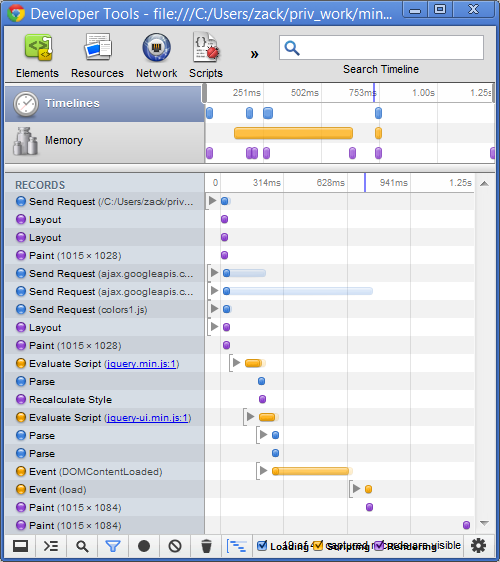
My point of reference - the time between the first page request and the end of the page rendering in the browser is 1.25 seconds. This is not bad, but not so good for such a simple page.
I want the code to work faster, but I don’t know what is slowing it down. The profiler should help find the cause.
Timeline shows the time of the code, but does not give information on the operation of parts of the code. We can change something and run the timeline again and again, but this is how to shoot at sparrows. The “Profiles” tab provides a more convenient way to see what is happening.
Profilers show which functions take the most time. Let's make the original profile by switching to the “Profiles” tab, where there are three types of profiling:
We want to make javascript faster, so we will use CPU profiling. To start the profiler, refresh the page and then stop the profiler.
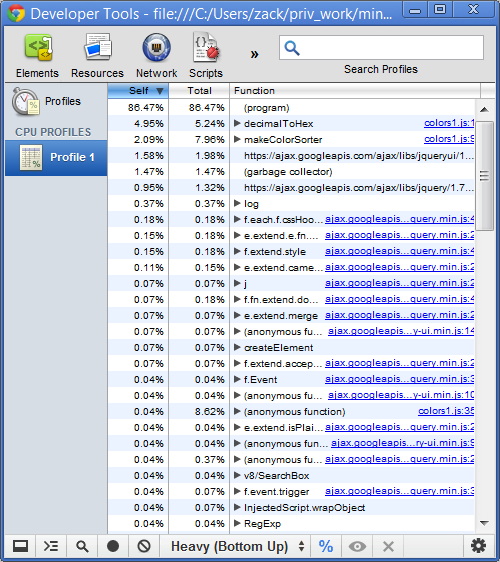
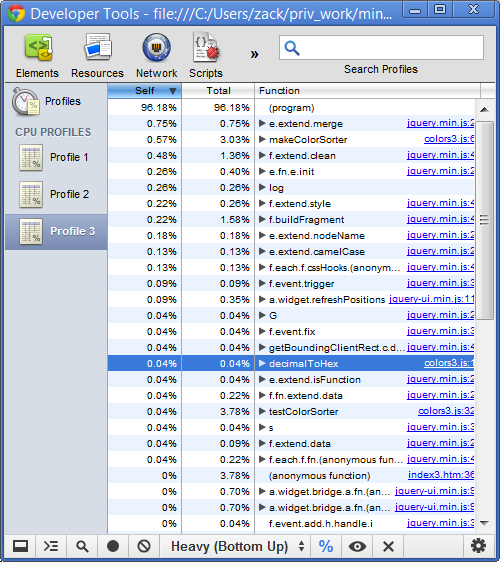
It can be seen that a lot of things are happening. The color sorter uses jQuery and jQuery UI, which do a lot of things like plugin control and regular expression parsing. You can also see that 2 of my functions are at the top of the list: decimalToHex and makeColorSorder. These 2 functions add up to 13.2% of processor time, so this is a good place to start improving.
You can click the arrow next to the function to display the full function call stack. In our case, I see that decimalToHex is called from makeColorSorter, and makeColorSorter is called from $ (document) .ready.
Here is the code:
Understanding where they are called from also gives an understanding that making colors overtightened is not the biggest performance problem. In this case, it takes more time to add DOM elements than to allow them to drag.
I want to make these functions faster, so the first thing to do is to isolate my changes. A lot of things happen when the page loads and I want to get rid of it when evaluating changes.
Instead of loading the color sorter after loading the document, I will make the second version , which waits while I press the button. This reduces the impact of other things that the browser does, and allows you to profile only the code. I'll get it back after I speed up my performance.
Let's call the new function testColorSorter and tie it to the button:
Changing the application could unpredictably affect performance. This change looks pretty safe, but I still want to run the profiler again to check if I’ve affected anything else. I will create a new profile by running the profiler, clicking a button in the application and stopping the profiler.

The first thing to pay attention to is the decimalToHex function, which now takes 4.23% of the load time; this is what lasts the longest in the code. Let's create a new starting point to see how the code improves in this scenario.
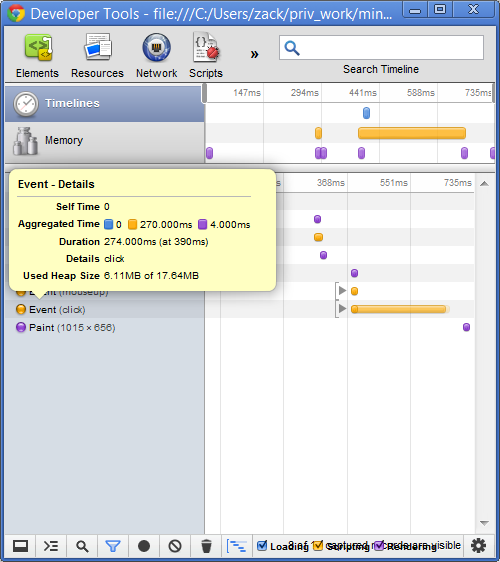
Several events occur before the button is pressed, but only the time between pressing the button and rendering the color sorter worries me. The button is pressed at the 390th millisecond, and the Paint event happened at the 726th millisecond; 726 minus 290 is the starting point - 390 milliseconds. Just like the first time, I ran three times and calculated the average.
Now I know where to look and the time of the code. We are ready to fix the problem.
The profiler only says which function leads to the problem, so we need to look inside it and understand what it is doing.
Each point in the color sorter takes the value of the background color in hex format like # 86F01B or # 2456FE. The decimalToHex function turns RGB values into hex colors that we can use on the page.
The function is pretty simple, but I left console.log there, which can be deleted. It also adds an indent to the beginning of the color. This is important because some decimal numbers can result in a single-character hexadecimal number; for example, the decimal “12” is the hexadecimal “C”, and the CSS requires 2 characters. We can make this conversion a little less general.
Version 3 of the color sorter changes the string only when it requires an indentation and does not cause substr. With this new feature, the code runs in 137 milliseconds. Profiling the code again, it is clear that the decimalToHex function now takes only 0.04% of the total time, moving itself far down the list.
We also see that now the most resource-intensive function is e.extend.merge from jQuery. I'm not sure what this function does, since the code is minified. I could add a jQuery version for developers, but I see that this function is called from makeColorSorter, so let's make it faster.
The colors of the rainbow in the color sorter are generated on the basis of a sine wave. The code looks at the center point of the Spectrum of colors and creates a sinusoid through this center point of the specified width. It transforms colors in a rainbow image. We can also change the colors in the rainbow by changing the frequency of red, green, and blue.
You can remove more console.log calls. These calls are especially harmful because they each time call the decimalToHex function, which means that decimalToHex is called 2 times more often than necessary.
This function greatly changes the DOM. Each time a loop body is executed, it adds a new div. Maybe this is somehow related to the fact that calls to e.extend.merge. Profiler allows you to test this with a simple experiment.
Instead of adding a new div every time I go through the loop, I’ll add all the div tags at once. Let's create a variable to store them and then add them one at a time.
This small code change means that the DOM will change once. By testing this in the timeline, we see that the execution time between the click and the Paint event is now 31 milliseconds. This one change reduced the execution time of version 4 by 87%. We can also run the profiler and see that the e.extend.merge function now takes so little time that it does not even appear at the top of the list.
We can make the code a little faster by completely removing the decimalToHex function. CSS supports RGB colors, so we don’t need to convert them to hex values. Now the makeColorSorter function looks like this:
Version 5 runs in just 26 milliseconds (acceleration in the final version is over 92%) and uses 18 lines of code instead of 28.
Real applications are much more complicated than this color sorter, but their profiling consists of the same steps:
There are some more rules when speeding up code:
Small changes in code can produce huge changes in performance. Just a few lines can mean the difference between a fast site and the “Unresponsive Script” dialog.
Set the starting point
We will analyze a simple application called a color sorter, which shows a table of colors that you can drag. Each point is a div with a little CSS added to make it look like a circle.
')
The page loads quickly enough, but it still needs some time and there is a slight blink before the drawing ends. It's time to do profiling and make it faster.
Always start your performance acceleration by setting the benchmark to know how fast or slow the application is at the moment. The point of the report will give you an understanding of whether you really speed up the program and help you make compromises.
Profiler is part of the Chrome Developer Tools, which is always available in Chrome. Press Ctrl + Shift + I to launch it. Chrome still has a great event tracking utility - Speed Tracer .
To define our point of reference, let's start recording in the “Timeline” tab, load the page and stop the recording (to start recording in the open Chrome Developer Tools, go to the “Timeline” tab and in the lower left corner click the icon - black circle - “Record”). Chrome is smart enough not to start recording until the page starts loading. I ran it 3 times and calculated the average.
My point of reference - the time between the first page request and the end of the page rendering in the browser is 1.25 seconds. This is not bad, but not so good for such a simple page.
I want the code to work faster, but I don’t know what is slowing it down. The profiler should help find the cause.
Creating a profile
Timeline shows the time of the code, but does not give information on the operation of parts of the code. We can change something and run the timeline again and again, but this is how to shoot at sparrows. The “Profiles” tab provides a more convenient way to see what is happening.
Profilers show which functions take the most time. Let's make the original profile by switching to the “Profiles” tab, where there are three types of profiling:
- JavaScript CPU profile
Shows how long the processor takes our javascript. - CSS selector profile
Shows how long the CPU takes to handle CSS selectors. - Heap snapshot
Shows how much memory our variables use in javascript
We want to make javascript faster, so we will use CPU profiling. To start the profiler, refresh the page and then stop the profiler.
It can be seen that a lot of things are happening. The color sorter uses jQuery and jQuery UI, which do a lot of things like plugin control and regular expression parsing. You can also see that 2 of my functions are at the top of the list: decimalToHex and makeColorSorder. These 2 functions add up to 13.2% of processor time, so this is a good place to start improving.
You can click the arrow next to the function to display the full function call stack. In our case, I see that decimalToHex is called from makeColorSorter, and makeColorSorter is called from $ (document) .ready.
Here is the code:
$(document).ready(function() { makeColorSorter(.05, .05, .05, 0, 2, 4, 128, 127, 121); makeSortable(); }); Understanding where they are called from also gives an understanding that making colors overtightened is not the biggest performance problem. In this case, it takes more time to add DOM elements than to allow them to drag.
I want to make these functions faster, so the first thing to do is to isolate my changes. A lot of things happen when the page loads and I want to get rid of it when evaluating changes.
Isolating the problem
Instead of loading the color sorter after loading the document, I will make the second version , which waits while I press the button. This reduces the impact of other things that the browser does, and allows you to profile only the code. I'll get it back after I speed up my performance.
Let's call the new function testColorSorter and tie it to the button:
function testColorSorter() { makeColorSorter(.05, .05, .05, 0, 2, 4, 128, 127, 121); makeSortable(); } //<button id="clickMe" onclick="testColorSorter();">Click me</button> Changing the application could unpredictably affect performance. This change looks pretty safe, but I still want to run the profiler again to check if I’ve affected anything else. I will create a new profile by running the profiler, clicking a button in the application and stopping the profiler.
The first thing to pay attention to is the decimalToHex function, which now takes 4.23% of the load time; this is what lasts the longest in the code. Let's create a new starting point to see how the code improves in this scenario.
Several events occur before the button is pressed, but only the time between pressing the button and rendering the color sorter worries me. The button is pressed at the 390th millisecond, and the Paint event happened at the 726th millisecond; 726 minus 290 is the starting point - 390 milliseconds. Just like the first time, I ran three times and calculated the average.
Now I know where to look and the time of the code. We are ready to fix the problem.
Make it faster
The profiler only says which function leads to the problem, so we need to look inside it and understand what it is doing.
function decimalToHex(d) { var hex = Number(d).toString(16); hex = "00".substr(0, 2 - hex.length) + hex; console.log('converting ' + d + ' to ' + hex); return hex; } Each point in the color sorter takes the value of the background color in hex format like # 86F01B or # 2456FE. The decimalToHex function turns RGB values into hex colors that we can use on the page.
The function is pretty simple, but I left console.log there, which can be deleted. It also adds an indent to the beginning of the color. This is important because some decimal numbers can result in a single-character hexadecimal number; for example, the decimal “12” is the hexadecimal “C”, and the CSS requires 2 characters. We can make this conversion a little less general.
function decimalToHex(d) { var hex = Number(d).toString(16); return hex.length === 1 ? '0' + hex : hex; } Version 3 of the color sorter changes the string only when it requires an indentation and does not cause substr. With this new feature, the code runs in 137 milliseconds. Profiling the code again, it is clear that the decimalToHex function now takes only 0.04% of the total time, moving itself far down the list.
We also see that now the most resource-intensive function is e.extend.merge from jQuery. I'm not sure what this function does, since the code is minified. I could add a jQuery version for developers, but I see that this function is called from makeColorSorter, so let's make it faster.
Reduce content change
The colors of the rainbow in the color sorter are generated on the basis of a sine wave. The code looks at the center point of the Spectrum of colors and creates a sinusoid through this center point of the specified width. It transforms colors in a rainbow image. We can also change the colors in the rainbow by changing the frequency of red, green, and blue.
function makeColorSorter(frequency1, frequency2, frequency3, phase1, phase2, phase3, center, width, len) { for (var i = 0; i < len; ++i) { var red = Math.floor(Math.sin(frequency1 * i + phase1) * width + center); var green = Math.floor(Math.sin(frequency2 * i + phase2) * width + center); var blue = Math.floor(Math.sin(frequency3 * i + phase3) * width + center); console.log('red: ' + decimalToHex(red)); console.log('green: ' + decimalToHex(green)); console.log('blue: ' + decimalToHex(blue)); var div = $('<div class="colorBlock"></div>'); div.css('background-color', '#' + decimalToHex(red) + decimalToHex(green) + decimalToHex(blue)); $('#colors').append(div); } } You can remove more console.log calls. These calls are especially harmful because they each time call the decimalToHex function, which means that decimalToHex is called 2 times more often than necessary.
This function greatly changes the DOM. Each time a loop body is executed, it adds a new div. Maybe this is somehow related to the fact that calls to e.extend.merge. Profiler allows you to test this with a simple experiment.
Instead of adding a new div every time I go through the loop, I’ll add all the div tags at once. Let's create a variable to store them and then add them one at a time.
function makeColorSorter(frequency1, frequency2, frequency3, phase1, phase2, phase3, center, width, len) { var colors = ""; for (var i = 0; i < len; ++i) { var red = Math.floor(Math.sin(frequency1 * i + phase1) * width + center); var green = Math.floor(Math.sin(frequency2 * i + phase2) * width + center); var blue = Math.floor(Math.sin(frequency3 * i + phase3) * width + center); colors += '<div class="colorBlock" style="background-color: #' + decimalToHex(red) + decimalToHex(green) + decimalToHex(blue) + '"></div>'; } $('#colors').append(colors); } This small code change means that the DOM will change once. By testing this in the timeline, we see that the execution time between the click and the Paint event is now 31 milliseconds. This one change reduced the execution time of version 4 by 87%. We can also run the profiler and see that the e.extend.merge function now takes so little time that it does not even appear at the top of the list.
We can make the code a little faster by completely removing the decimalToHex function. CSS supports RGB colors, so we don’t need to convert them to hex values. Now the makeColorSorter function looks like this:
function makeColorSorter(frequency1, frequency2, frequency3, phase1, phase2, phase3, center, width, len) { var colors = ""; for (var i = 0; i < len; ++i) { var red = Math.floor(Math.sin(frequency1 * i + phase1) * width + center); var green = Math.floor(Math.sin(frequency2 * i + phase2) * width + center); var blue = Math.floor(Math.sin(frequency3 * i + phase3) * width + center); colors += '<div class="colorBlock" style="background-color: rgb(' + red + ',' + green + ',' + blue + ')"></div>'; } $('#colors').append(colors); } Version 5 runs in just 26 milliseconds (acceleration in the final version is over 92%) and uses 18 lines of code instead of 28.
Profiling JavaScript in your application
Real applications are much more complicated than this color sorter, but their profiling consists of the same steps:
- Determine the starting point so you know where you are starting from.
- Isolate the problem by separating it from another code in the application.
- Make it faster in a controlled environment with frequent use of timeline and profiling.
There are some more rules when speeding up code:
- Start with the slowest parts to get the most out of your time spent improving.
- Control the environment . If you change the computer, update the browser or plug-ins, always re-read the reference point.
- Repeat the analysis to prevent anomalies from affecting the result.
Source: https://habr.com/ru/post/149053/
All Articles