12 more “MySQL recipes” in Bitrix24

 In our last article - “11“ MySQL recipes ”in Bitrix24” - we mainly considered architectural solutions: should we use cloud services (like Amazon RDS), which MySQL fork to use, etc.
Judging by the reviews, the topic of competent operation of MySQL in large “highload” projects is very large and important. Therefore, we decided to talk about some of the nuances of setting up and administering the database that we encountered during the development of Bitrix24 and which we use every day.
')
Let me remind you once again that this article (like the previous one) is not a universal “recipe” for the perfect MySQL setup for all occasions. :) This does not happen. :) But sincerely I believe that it will be useful for you to solve specific problems.
And at the end of the article - a surprise for the most patient readers. :)
1. Configure QUERY CACHE
There are a huge number of articles describing exactly how Query Cache works in MySQL, and how to configure and use it.
And still, despite this, the most frequent misconception of system administrators who configure the database is " The more memory we give the cache, the better ."
This is not true.
MySQL doesn’t handle Query Cache large enough. In practice, faced with the fact that when query_cache_size is more than 512M, more and more processes appear that briefly hang in the state “waiting for query cache lock” (seen in SHOW PROCESSLIST).
In addition, if all your requests are in the cache, it is unwise to increase it. RAM in the system is precious!
Therefore, it is always important to understand what is happening in your project and how efficiently Query Cache is used with the current settings.
Key information for you is here:
mysql> SHOW STATUS LIKE 'Qcache%'; +-------------------------+----------+ | Variable_name | Value | +-------------------------+----------+ | Qcache_free_blocks | 10541 | | Qcache_free_memory | 36381984 | | Qcache_hits | 18888719 | | Qcache_inserts | 5677585 | | Qcache_lowmem_prunes | 1725258 | | Qcache_not_cached | 6096307 | | Qcache_queries_in_cache | 36919 | | Qcache_total_blocks | 97285 | +-------------------------+----------+ 8 rows in set (0.00 sec) The most important are the ratios of Qcache_hits and Qcache_inserts, Qcache_inserts and Qcache_not_cached, as well as Qcache_lowmem_prunes - the number of queries that were forced out of the cache - and Qcache_free_memory.
It is best not to look at these statistics only sporadically, but to have an analyst at hand. It can be collected using various monitoring tools. For example, Munin:

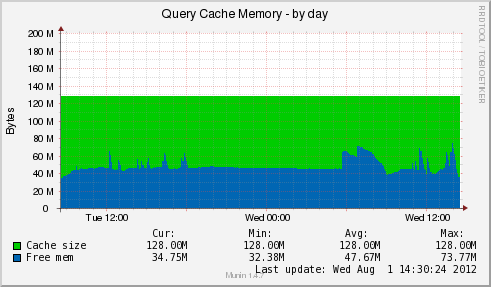
Looking at the graphs in the dynamics - once a day, for example, we finally came to the conclusion that for us such settings for one server are enough:
query_cache_size = 128M query_cache_limit = 2M Of course, perhaps for your project the picture will be different.
2. innodb_buffer_pool_size
Buffer Pool size is one of the most important InnoDB settings. This is the size of the memory buffer that MySQL uses in its work for the data cache and table indexes (just to remind you that in order to avoid double caching - by MySQL itself and the operating system, you should specify innodb_flush_method = O_DIRECT ).
From the side of the MySQL developers, one of the greatest crimes is to set the default value to 8M. :)
In fact, ideally, the value of innodb_buffer_pool_size should be such that all your base is stored in memory. At the same time, it is important to remember about the balance of the system from memory (we talked about this in the last article ) - if you “invert” the value of innodb_buffer_pool_size so that the whole system goes into a swap, nothing good will happen.
A good indicator of the correct setting is Buffer pool hit rate:
mysql> SHOW ENGINE InnoDB STATUS\G ... ---------------------- BUFFER POOL AND MEMORY ---------------------- ... Buffer pool hit rate 994 / 1000, young-making rate 6 / 1000 not 0 / 1000 ... If the value is close to "1000/1000" - all is well. Otherwise, it is necessary to increase innodb_buffer_pool_size . If this is not enough memory - add memory.
3. innodb_buffer_pool_instances
By default, InnoDB uses one instance for the Buffer Pool.
At the same time, it is possible to select several blocks - and in some cases MySQL works with them in InnoDB much more efficiently.
Buffer Pool is divided into several instances if it exceeds 2 GB. The size of each instance is worth doing 1 GB or more.
And here is an important question that many are confused with: is innodb_buffer_pool_size the total pool size or the size of one instance?
The answer is right in the documentation - this is the total size. Therefore, for example, this is the configuration:
innodb_buffer_pool_size = 4096M innodb_buffer_pool_instances = 4 ... says that each instance will occupy 1 GB.
Be careful that there are no incidents (one friend, subscribing to MySQL DBA, described his MySQL operating experience with the settings innodb_buffer_pool_size = 1024M, innodb_buffer_pool_instances = 64 - planning to allocate 64 GB - and was outraged that it was somehow bad with performance ... :))
4. innodb_io_capacity
An interesting parameter, which seems to be (if you believe the official documentation :)), and does not greatly affect the performance, however, in practice it gives some gain if it is properly configured.
innodb_io_capacity sets the limit of I / O operations (in IOPS) for those InnoDB operations that are performed in the background (for example, flushing pages from the Buffer Pool to disk).
The default is 200.
Too small a value will result in these operations lagging behind. Too much will cause the Buffer Pool data to be flushed too quickly.
Ideally, you should set the value corresponding to the real performance of your disk system (again - in IOPS).
5. innodb_file_per_table
By default, MySQL in InnoDB stores the data and indexes of all tables in a single tablespace - the ibdata1 file.
If the innodb_file_per_table option is used in the settings, then in this case a separate file table_name.ibd is created for each table, in which data and indexes are stored.
Does this option make sense?
In my personal opinion: if you use standard MySQL, you do not need to use it. Storing tables in separate files can reduce performance, since the number of “expensive” resource-intensive file opening operations will increase dramatically in the system.
We ourselves use Percona Server. And use innodb_file_per_table .
- If in ordinary MySQL one or several tables will be beaten for some reason, the whole database will “get up”. In Perkone, you can use the option innodb_corrupt_table_action = assert , and then when using innodb_file_per_table, the “broken” table will be marked, but the entire database will continue to work.
- Already now there is an opportunity to “speed up” some operations that clearly lose in performance when using innodb_file_per_table . For example, deleting tables. For such purposes, Perkone has the option innodb_lazy_drop_table = 1 , which allows such operations to be performed in the background and does not reduce the overall system performance.
- With the innodb_file_per_table option enabled using XtraBackup, you can make quick binary import / export tables.
6. max_connect_errors
Another criminal :) plot of MySQL developers. The max_connect_errors value is 10 by default.
This means that in any more or less active project in the event of any unexpected failure - even a short-term (for example, they registered the wrong password in the scripts; or there were some network problems) - after the specified number of unsuccessful attempts to establish a connection, the connection is established will be blocked. Until the MySQL server is restarted or the FLUSH HOSTS command is executed.
This means that prior to manual intervention (only if you did not pre-hang a script on cron that runs FLUSH HOSTS every few minutes :)) your project will not work. It is unpleasant if this happens at night, and you do not have round-the-clock monitoring.
It is better to protect yourself in advance and set the value of max_connect_errors to large. For example:
max-connect-errors = 10000 7. Temporary tables
If the amount of RAM in the system allows - it is better to always work in memory with temporary tables.
To organize it is quite simple. In MySQL settings:
tmpdir = /dev/shm In the settings of file systems and partitions (if we are talking about Linux, in the / etc / fstab file):
# <file system> <mount point> <type> <options> <dump> <pass> tmpfs /dev/shm tmpfs defaults 0 0 8. Size of temporary tables
There are two similar parameters responsible for the size of tables in memory:
max_heap_table_size = 64M tmp_table_size = 64M max_heap_table_size is the maximum size of MEMORY type tables that a user can create.
tmp_table_size - the maximum size of the temporary table that will be created in memory (more - on the disk).
The smaller the disk activity, the better. Therefore, if the amount of RAM in the system allows (remember memory balancing), it is better to work with all temporary tables in memory.
9. table_cache and table_definition_cache
table_cache = 4096 table_definition_cache = 4096 These two options are responsible for what the maximum number of tables will be stored in the cache of open tables.
The value of table_cache directly depends on the number of tables in your system, on the number of opened tables in the query (linked through JOINs, for example) and on the number of open connections to the database.
table_definition_cache determines the size of the cache for table structures (.frm) files. The more of them in the system, the greater the value of table_definition_cache needs to be set.
10. Fight for long requests
In the last article, we already mentioned that Percona Server has a good tool for determining overall system performance ( SELECT * FROM INFORMATION_SCHEMA.QUERY_RESPONSE_TIME ).
In addition, in any MySQL it is possible to log all “slow” queries and separately parse them.
When using Percona Server, the slow query log becomes much more informative.
log_output = FILE slow_query_log = 1 slow_query_log_file = mysql_slow.log long_query_time = 1 #percona log_slow_verbosity = microtime,query_plan,innodb All requests running for longer than 1 second are recorded in the mysql_slow.log file. Unlike the standard log, it looks like this:
# Time: 120712 9:43:47 # User@Host: user[user] @ [10.206.66.207] # Thread_id: 3513565 Schema: user Last_errno: 0 Killed: 0 # Query_time: 1.279800 Lock_time: 0.000053 Rows_sent: 0 Rows_examined: 1 Rows_affected: 0 Rows_read: 0 # Bytes_sent: 52 Tmp_tables: 0 Tmp_disk_tables: 0 Tmp_table_sizes: 0 # InnoDB_trx_id: 33E7689B # QC_Hit: No Full_scan: No Full_join: No Tmp_table: No Tmp_table_on_disk: No # Filesort: No Filesort_on_disk: No Merge_passes: 0 # InnoDB_IO_r_ops: 0 InnoDB_IO_r_bytes: 0 InnoDB_IO_r_wait: 0.000000 # InnoDB_rec_lock_wait: 0.000000 InnoDB_queue_wait: 0.000000 # InnoDB_pages_distinct: 4 UPDATE b_user_option SET 'COMMON' = 'N', 'VALUE' = 'a:19', 'NAME' = 'openTab', 'CATEGORY' = 'IM' WHERE ID=1719; We see not only the query execution time, the number of “scanned” rows, etc., but also much more detailed information — Full Scan's, the use of temporary tables, the state of InnoDB.
All this helps a lot in analyzing slow queries and debugging them.
11. Detailed statistics without Percona
Even if you use standard MySQL, then it has good query debugging tools (of course, if you have already “caught” them and identified :) - for example, using the same slow query log).
There is such a thing as Profiles. Do you use them? Not? In vain!
mysql> SHOW PROFILES; Empty set (0.02 sec) mysql> SHOW PROFILE; Empty set (0.00 sec) We turn on profiling and look at any request:
mysql> SET PROFILING=1; Query OK, 0 rows affected (0.00 sec) mysql> SELECT COUNT(*) FROM mysql.user; +----------+ | COUNT(*) | +----------+ | 3024 | +----------+ 1 row in set (0.09 sec) mysql> SHOW PROFILES; +----------+------------+---------------------------------+ | Query_ID | Duration | Query | +----------+------------+---------------------------------+ | 1 | 0.09104400 | SELECT COUNT(*) FROM mysql.user | +----------+------------+---------------------------------+ 1 row in set (0.00 sec) mysql> SHOW PROFILE; +--------------------------------+----------+ | Status | Duration | +--------------------------------+----------+ | starting | 0.000018 | | Waiting for query cache lock | 0.000004 | | Waiting on query cache mutex | 0.000004 | | checking query cache for query | 0.000041 | | checking permissions | 0.000007 | | Opening tables | 0.090854 | | System lock | 0.000013 | | init | 0.000012 | | optimizing | 0.000007 | | executing | 0.000010 | | end | 0.000005 | | query end | 0.000004 | | closing tables | 0.000031 | | freeing items | 0.000029 | | logging slow query | 0.000003 | | cleaning up | 0.000004 | +--------------------------------+----------+ 16 rows in set (0.00 sec) We immediately see that the bottleneck is the network, working with the disk, using the cache or something else.
12. How to use information from profile?
If you have learned how to find single long queries (this is not so difficult - the slow query log and SHOW PROCESSLIST to help), if you correctly assess the state of the system as a whole ( SELECT * FROM INFORMATION_SCHEMA.QUERY_RESPONSE_TIME , external monitoring of the system, for example, nagios - real time, munin - analytics), it is extremely important to understand that the system can affect performance:
- all internal system resources - there is no “too much” for the base, neither CPU, nor RAM, nor disk system;
- locking (at the table level - more often in MyISAM, at the row level - InnoDB);
- internal locking (for example, “waiting for query cache lock”).
Understanding this and analyzing data from the profile or, for example, from the extended log of slow queries, you can always correctly evaluate the future strategy of working with the database - in which cases an iron upgrade will be required, in which it is necessary to change certain settings, and where - possibly, reorganization data structures and queries.
* * *
Successful debugging and successful operation of databases of any size and with any load! :)
* * *
Thank you for reading this place! :)

I hope our tips on working with MySQL will be useful for you!
And since we are talking about our experience of operating MySQL in the project "Bitrix24" , we would like to make a small gift for all readers of our blog on Habré.
Register in “Bitrix24” at the indicated link and get twice as much disk - 10 GB - at a free rate!
If suddenly you still do not know what “Bitrix24” is - a detailed description is on our website . :)
Source: https://habr.com/ru/post/148874/
All Articles