Manage event logs: NetWrix Event Log Manager 4.0 Program Overview
We recently published a post on 10 critical event IDs that need to be monitored. And, frankly, we were very surprised at how many users downloaded our program for managing Event Log Manager magazines, which we wrote about at the very end of the article. Therefore, in this post we would like to talk about what the program is and what journal management tasks it helps to solve. Also at the end of the review there is a presentation in which the work of the program is demonstrated. We invite interested persons under cat.

Working with the event logs, you must have come across the need to analyze data separately on each of the domains. In addition, if no special messages are accepted (the “Archive log data is checked” in…), the records have the property to be cleared (overwritten). And the free space has the property of quickly ending. Therefore, special solutions are being developed to supplement the functionality of event logs. Some of them develop into large-scale SIEM systems, some are designed to solve very specific tasks of analysis, notification and consolidation. It is about the last version that will be discussed in this review.
')
 NetWrix Event Log Manager is a program designed to consolidate data from event logs and their archiving, as well as to create alerts for specified events in real time. We have just released a new release of the program (v 4.0), in which the following functionality is present:
• Consolidation of all event log data and syslog 'a across all networks to the central storage (the new version adds monitoring of the syslog logs of Red Hat Linux and Ubuntu 11 ).
• Compress and archive the collected data for easy analysis, data loss prevention and audit purposes.
• Store log entries in a SQL database.
• Identify critical events and send email notifications.
• Reports based on SQL Reporting Services (SRS) with the ability to filter, group and sort; standard reports to meet the requirements of information security standards (GLBA, HIPAA, SOX, and PCI).
• Reporting for any specified period in the past.
The principle of the program is shown in the figure below.

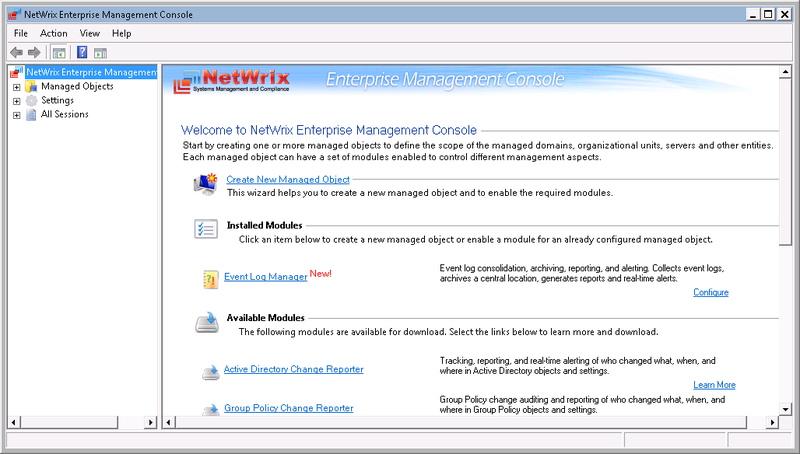
The work with the full version of the program is carried out through the NETWRIX ENTERPRISE MANAGEMENT CONSOLE console, which allows you to configure monitored objects, set their settings and customize reports (in the free version, configuration and tuning is done in one window).
Inside the console you can:
• Manage the settings of all NetWrix programs to audit changes through a single interface.
• Create and configure Observed Objects for Windows and Syslog Platforms
• Activate and configure advanced reports (based on SSRS)
• Enable and configure real-time notifications
• Activate and configure long-term data archiving
• View reports in the embedded browser.
• Activate and set up a subscription to reports
• Perform one-time setup of all monitored objects.
NetWrix Event Log Manager collects audit data, stores it in an audit archive and / or SQL database, and sends event summary reports (default at 3:00).
To manually get the final results on the events, in the NetWrix Enterprise Management Console, you need to expand the Managed Objects node, select the observed object and click Run .

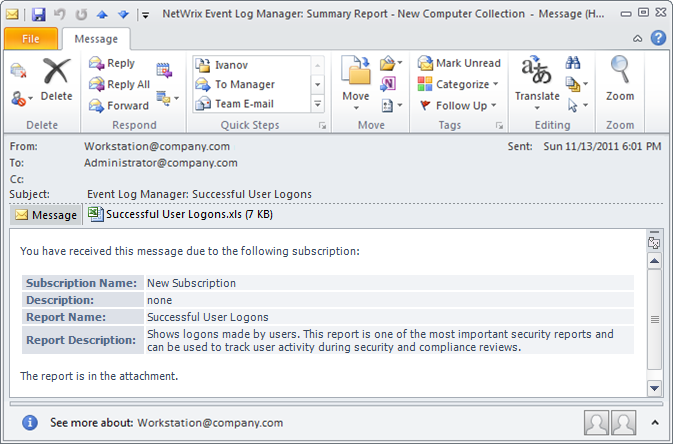
Final Results Received by Email

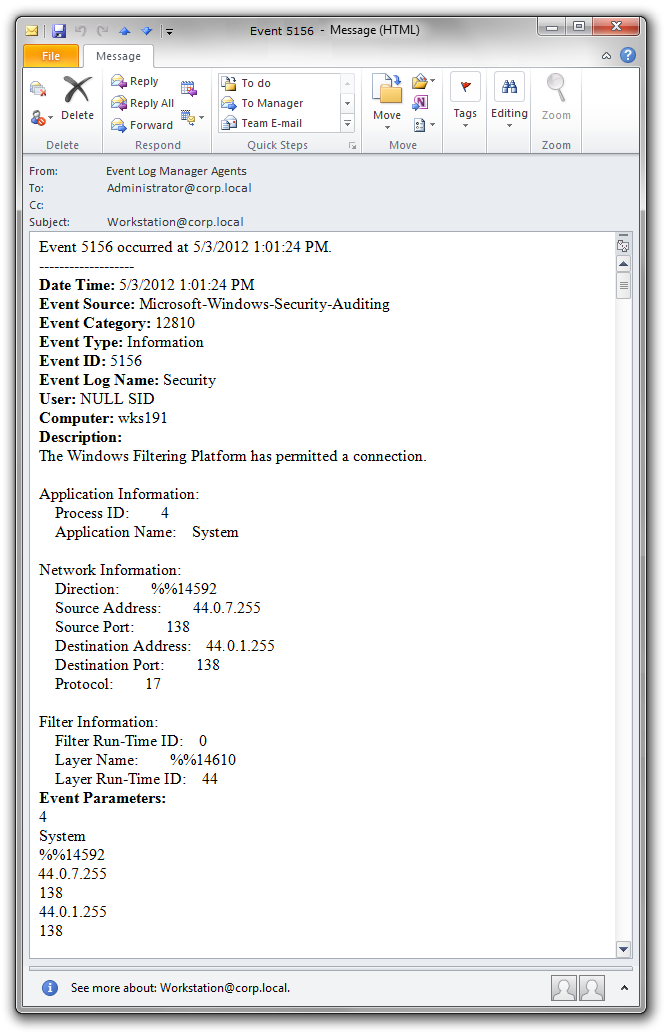
Sample Real-Time Notification
Reports
There are two types of reports available in the NetWrix Event Log Manager.
• Event summary reports
• Expanded reports (based on SQL Server Reporting Services)
Event Summary Reports
These reports contain summary information about errors that occurred since the last report was generated. By default, final reports are sent to specified recipients every 24 hours.
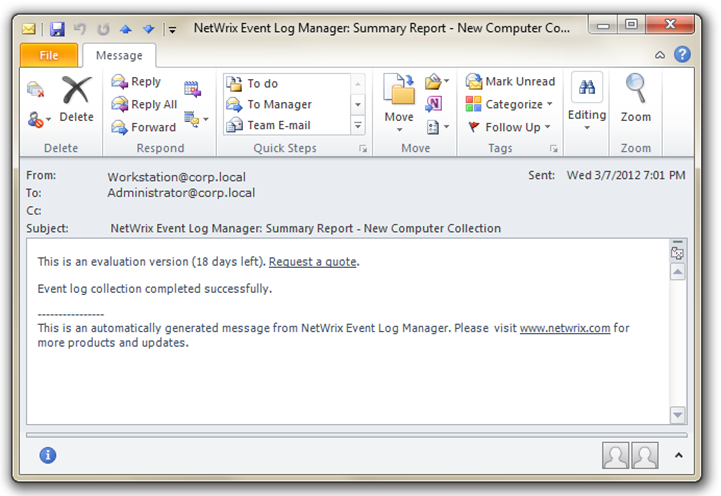
If there are no errors , the report is as follows.
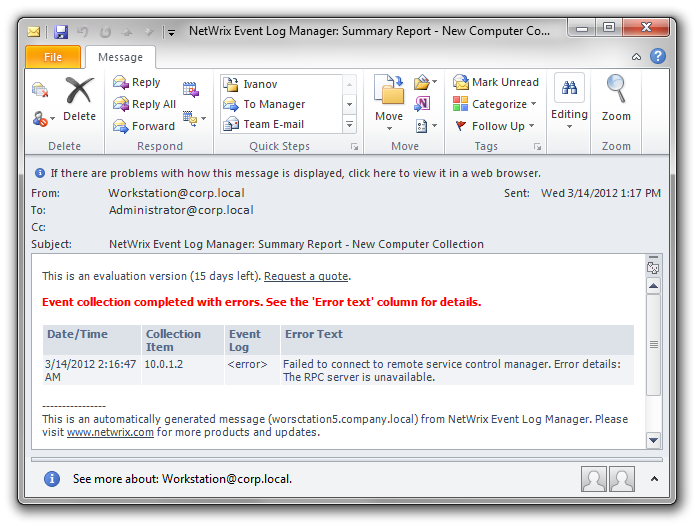
If an error was noticed during data collection, then the following type of message is sent immediately to all recipients:
Advanced reports
The NetWrix Event Log Manager functionality allows you to create reports based on SQL Server Reporting Services.
The program has many ready-made report templates.
Access to reports can be obtained through the console ( Managed Object - <Your_observed_object> - Event Log Manager - Reports )
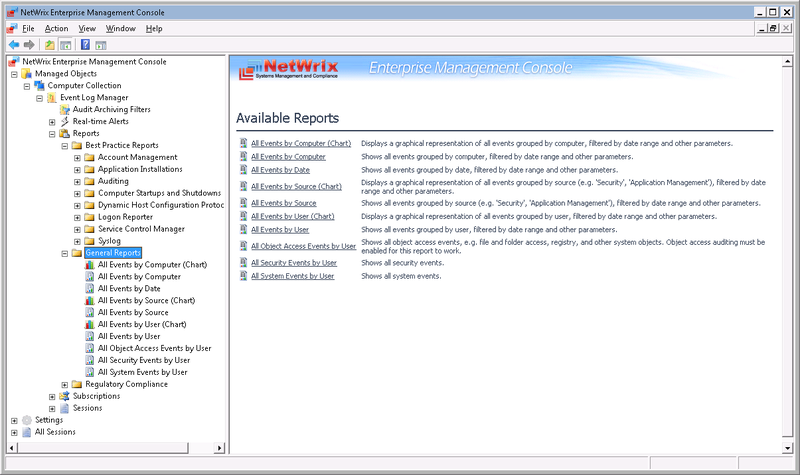
The following reports are available.
• Best Practice Reports
• General Reports
• Regulatory Compliance
Reports can be viewed both in the console and in the browser.
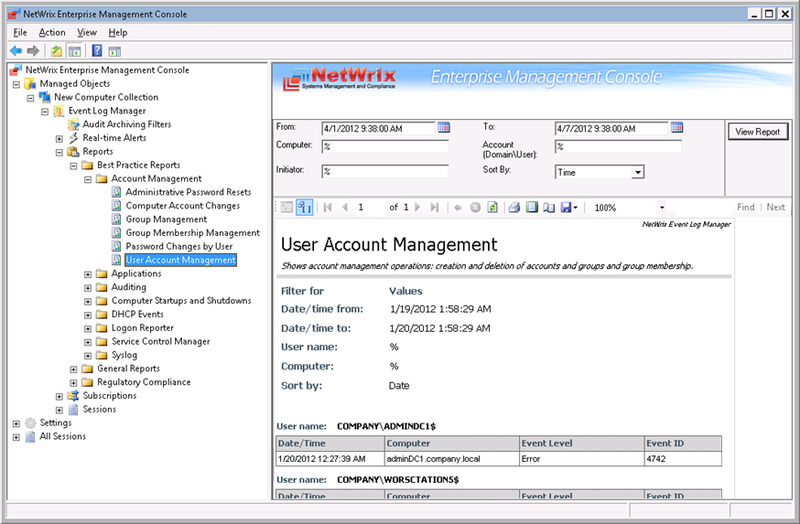
View in console:
Select the required report. Managed Objects - <Your_observed_object> - Event Log Manager - Reports - <report_type>
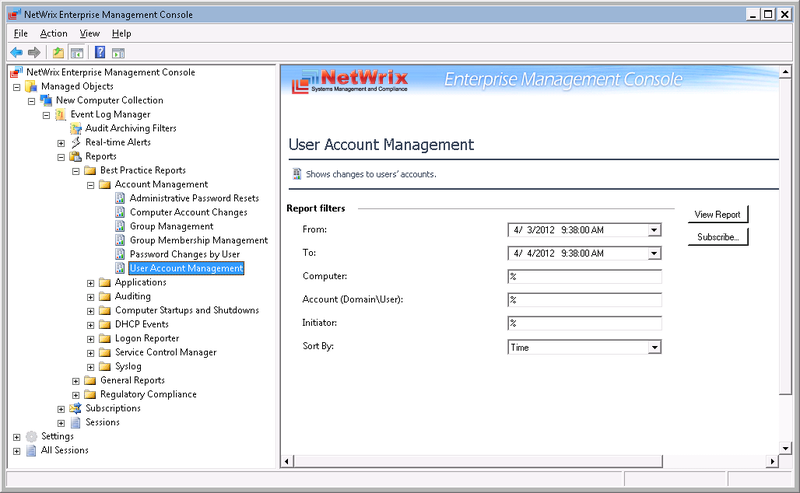
Set filters and run reports (View Report)
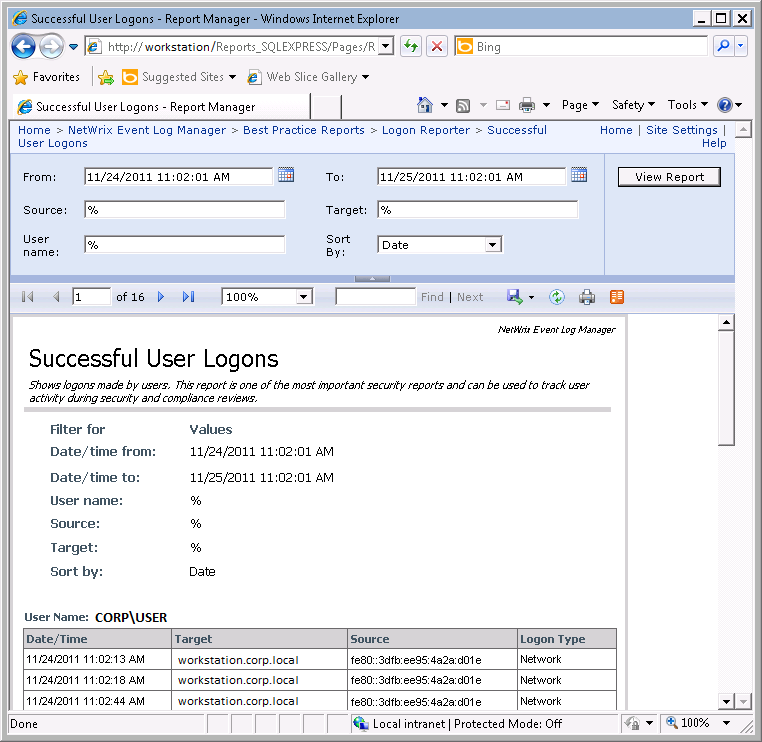
View report in browser
In the browser, enter the address of the SQL Server Report Manager. The next page will be displayed.
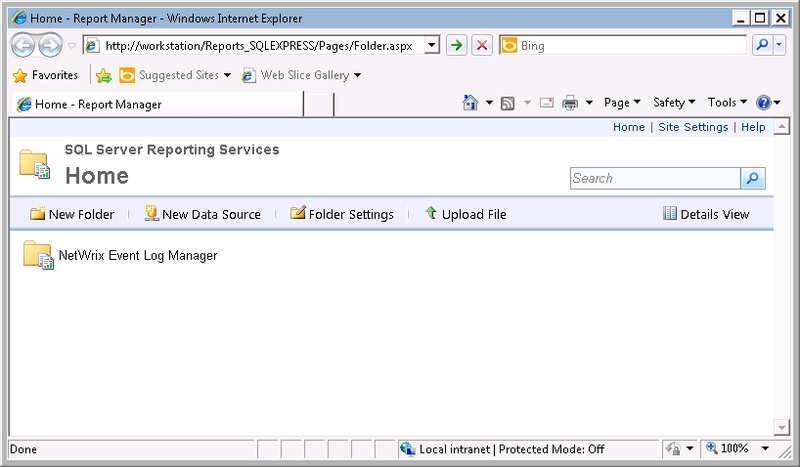
Select the report you need and set up filters if necessary.
Data can also be viewed through a subscription.
NetWrix Database Importer is a tool for importing data from an audit archive into a SQL database. You can use it to manually import events into the SQL database, if you initially configured it only to record events in the audit archive or to restore it if the SQL database is corrupted.
First, you need to specify the period for which data will be imported (separately for each object).

You must specify the parameters (select the observed object, computer, type of log, and period).
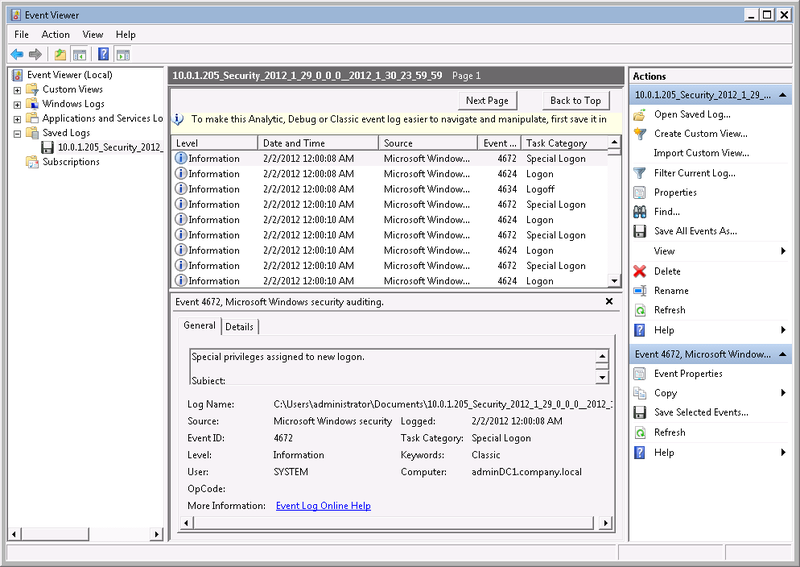
Events are written to the .evt file. They can be viewed later using the Windows Event Viewer.
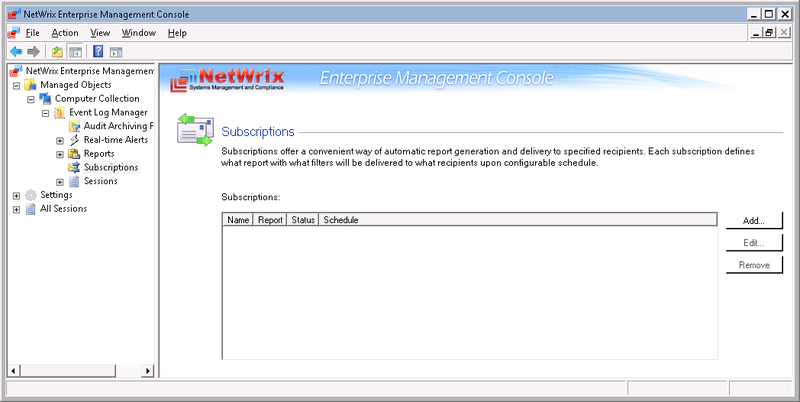
In NetWrix Event Log Manager, you can configure automatic reporting by creating a subscription. Reports will be generated automatically and sent to predefined recipients.
To create a subscription, you need to expand the Managed Objects - <your_managed_object> - Event Log Manager node and select Subscriptions
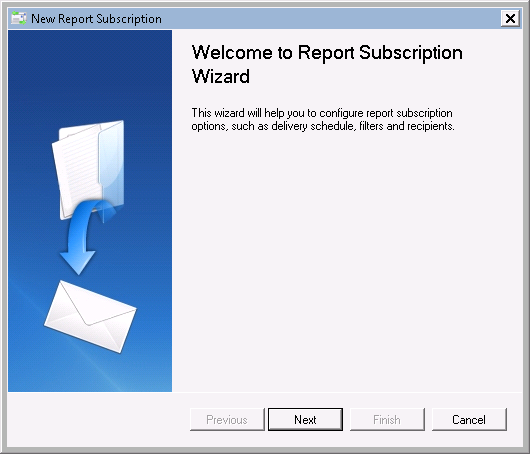
Click Add and the New Report Subscription Wizard starts.
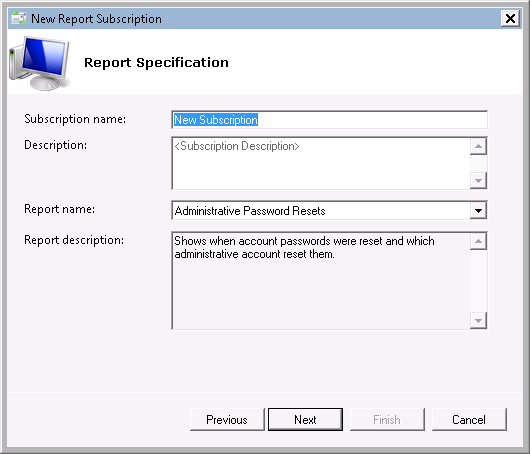
Set a subscription name and select the report on the basis of which the subscription will be formed.
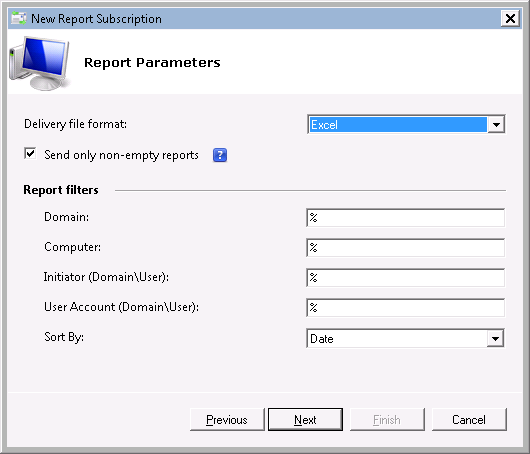
Set subscription parameters (format, filters, sorting)
Then you can choose the frequency of sending reports by subscription:
• Daily
• Weekly
• Monthly
Subscriptions can later be changed through the NetWrix Enterprise Management Console.
You can also configure Reports by clicking on the Configure button.

You can clearly see all the same in the presentation
And, of course, download the program itself on our website !
A free version is available for 10 domain controllers and 100 computers.
Working with the event logs, you must have come across the need to analyze data separately on each of the domains. In addition, if no special messages are accepted (the “Archive log data is checked” in…), the records have the property to be cleared (overwritten). And the free space has the property of quickly ending. Therefore, special solutions are being developed to supplement the functionality of event logs. Some of them develop into large-scale SIEM systems, some are designed to solve very specific tasks of analysis, notification and consolidation. It is about the last version that will be discussed in this review.
')
NetWrix Event Log Manager is a program designed to consolidate data from event logs and their archiving, as well as to create alerts for specified events in real time. We have just released a new release of the program (v 4.0), in which the following functionality is present:• Consolidation of all event log data and syslog 'a across all networks to the central storage (the new version adds monitoring of the syslog logs of Red Hat Linux and Ubuntu 11 ).
• Compress and archive the collected data for easy analysis, data loss prevention and audit purposes.
• Store log entries in a SQL database.
• Identify critical events and send email notifications.
• Reports based on SQL Reporting Services (SRS) with the ability to filter, group and sort; standard reports to meet the requirements of information security standards (GLBA, HIPAA, SOX, and PCI).
• Reporting for any specified period in the past.
The principle of the program is shown in the figure below.
Overview NETWRIX ENTERPRISE MANAGEMENT CONSOLE
The work with the full version of the program is carried out through the NETWRIX ENTERPRISE MANAGEMENT CONSOLE console, which allows you to configure monitored objects, set their settings and customize reports (in the free version, configuration and tuning is done in one window).
Inside the console you can:
• Manage the settings of all NetWrix programs to audit changes through a single interface.
• Create and configure Observed Objects for Windows and Syslog Platforms
• Activate and configure advanced reports (based on SSRS)
• Enable and configure real-time notifications
• Activate and configure long-term data archiving
• View reports in the embedded browser.
• Activate and set up a subscription to reports
• Perform one-time setup of all monitored objects.
Data collection
NetWrix Event Log Manager collects audit data, stores it in an audit archive and / or SQL database, and sends event summary reports (default at 3:00).
To manually get the final results on the events, in the NetWrix Enterprise Management Console, you need to expand the Managed Objects node, select the observed object and click Run .
Final Results Received by Email
Sample Real-Time Notification
Reports
There are two types of reports available in the NetWrix Event Log Manager.
• Event summary reports
• Expanded reports (based on SQL Server Reporting Services)
Event Summary Reports
These reports contain summary information about errors that occurred since the last report was generated. By default, final reports are sent to specified recipients every 24 hours.
If there are no errors , the report is as follows.
If an error was noticed during data collection, then the following type of message is sent immediately to all recipients:
Advanced reports
The NetWrix Event Log Manager functionality allows you to create reports based on SQL Server Reporting Services.
The program has many ready-made report templates.
Access to reports can be obtained through the console ( Managed Object - <Your_observed_object> - Event Log Manager - Reports )
The following reports are available.
• Best Practice Reports
• General Reports
• Regulatory Compliance
Reports can be viewed both in the console and in the browser.
View in console:
Select the required report. Managed Objects - <Your_observed_object> - Event Log Manager - Reports - <report_type>
Set filters and run reports (View Report)
View report in browser
In the browser, enter the address of the SQL Server Report Manager. The next page will be displayed.
Select the report you need and set up filters if necessary.
Data can also be viewed through a subscription.
Import Audit Data
NetWrix Database Importer is a tool for importing data from an audit archive into a SQL database. You can use it to manually import events into the SQL database, if you initially configured it only to record events in the audit archive or to restore it if the SQL database is corrupted.
First, you need to specify the period for which data will be imported (separately for each object).
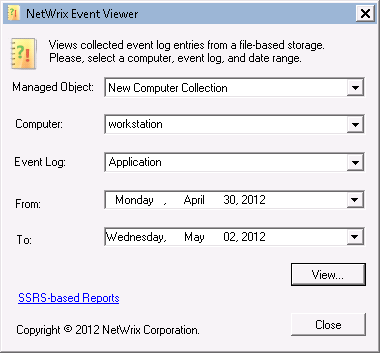
View data in the NetWrix Event Viewer
You must specify the parameters (select the observed object, computer, type of log, and period).
Events are written to the .evt file. They can be viewed later using the Windows Event Viewer.
Creating a subscription to a report
In NetWrix Event Log Manager, you can configure automatic reporting by creating a subscription. Reports will be generated automatically and sent to predefined recipients.
To create a subscription, you need to expand the Managed Objects - <your_managed_object> - Event Log Manager node and select Subscriptions
Click Add and the New Report Subscription Wizard starts.
Set a subscription name and select the report on the basis of which the subscription will be formed.
Set subscription parameters (format, filters, sorting)
Then you can choose the frequency of sending reports by subscription:
• Daily
• Weekly
• Monthly
Subscriptions can later be changed through the NetWrix Enterprise Management Console.
You can also configure Reports by clicking on the Configure button.
You can clearly see all the same in the presentation
And, of course, download the program itself on our website !
A free version is available for 10 domain controllers and 100 computers.
Source: https://habr.com/ru/post/148369/
All Articles