GC and big heap: friends or foes?
The debate about what is better: manual control or automatic is conducted in many areas of science and technology. Rely on a person or surrender to impassive mechanisms and algorithms? It seems that in the world of creating Enterprise solutions, the scales leaned towards automatic memory management, mostly because of messing with pointers, manual memory management and painting gray hair after every bug that appeared due to the “wrong” compiler C / C ++ does not want anyone now. But still there are topics on the forums, where the harsh adherents of manual memory management fiercely and implacably defend their retrograde views in the fight against the progressive part of humanity. Let them leave them alone.
One of the most frequently used platforms with automatic memory management mechanisms is Java. But, automatic memory management has brought not only comfort to the hard work of programmers, but also its own shortcomings, which we have to face more and more often. Modern multi-user applications that can handle a huge flow of transactions require significant hardware resources, the size of which was previously difficult to even imagine. However, it’s not about the size of these resources, the fact is that the garbage collector that exists in most modern JVMs cannot work efficiently with large amounts of memory.
The garbage collector automates the process of clearing the memory and saves the programmer from many headaches, introducing instead one big problem - which GC mechanism to use and what size of heap will be the most optimal? If you make more than necessary heap and encounter constant “stop-the-world” pauses, make less than necessary, then “Out of memory” errors will appear. All this is complicated by the fact that with an increase in the heap-a size, the garbage collector needs more time to clear the memory and defragment it. This leads to the fact that when using a heap-a of more than 2-4GB, the pauses become critical for the business and take a few seconds, or even minutes, during which all threads have to wait until the memory cleaning process is completed. The response time increases and becomes unstable, bandwidth drops - for large web portals, companies working in the field of e-commerce or business-critical applications, this is unacceptable.
There are several ways to deal with a large heap-a, one of which is deploying a few dozen or hundreds of copies or taking storage of data outside the heap-a area. I do not want to touch them in this article, leaving the future discussion. I would like to note that these methods are quite expensive, since they imply a lot of developers and administrators work necessary to bring them to life. We will remain within the framework of the JVM, without inventing "crutches" and workaround solutions, the support of which then takes time, nerves and money.
')
It's no secret that GC in common JVM has several modes of operation, and some of them are designed precisely to reduce the so-called “stop-the-world” pauses, during which all threads stop. Nevertheless, it is impossible to exclude these pauses for technological reasons, with one exception, which I will discuss below. This means that even at best, the threads will still have to wait until the GC finishes clearing the memory. More and more, this becomes unacceptable - business cannot wait.
In this article I will try to conduct a brief overview of the most common JVMs, as well as talk about the methods proposed by these JVMs for the effective work of GC with large heap. I think resource visitors are familiar with the concept of heap in the JVM and know what it is. It also makes no sense to explain about the generation of objects, one has only to note that it is assumed that the objects belonging to the younger generation, often become unattainable and are removed from memory. I will give a drawing heap-a:
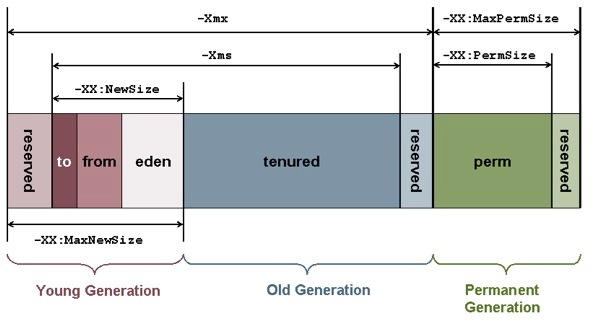
The main algorithms that use GC in their work:
Mark-Sweep-Compact
Mark: marks unused objects.
“Sweep”: these objects are deleted from memory.
“Compact”: objects are “compacted”, occupying free slots, which frees up space in case you need to create a “large” object.
Throughout all three steps, there is a “stop-the-world” pause.
Copying collector
Performs all three actions in a single pass, using the “from” and “to” areas. This happens as follows: at the beginning of work, one of the survivor spaces, “To”, is empty, and the other, “From”, contains objects that survived previous assemblies. The garbage collector searches for live objects in Eden and copies them to To space, and then copies live and “young” (that is, not still surviving a given number of garbage collections, tenuring threshold) objects from From space. Old objects from From space are moved to the Old generation. After assembling, From space and To space change roles, the Eden area becomes empty, and the number of objects in the Old generation increases. If in the process of copying live objects To space is full, then the remaining live objects from Eden and From space, which did not have enough space in To space, will be moved to the Old generation, regardless of how many garbage collections they have experienced.
Since using this algorithm, the garbage collector simply copies all living objects from one memory area to another, such a garbage collector is called copying. Obviously, for a copying garbage collector to work, an application should always have a free memory area into which living objects will be copied, and such an algorithm can be used for memory areas that are relatively small relative to the total memory size of the application.
The main drawback of existing GCs is the need for pauses. These pauses are the result of inevitable events due to memory fragmentation. Even if we use the so-called "mostly concurrent" (in most cases simultaneous) garbage collection algorithms, anyway, sooner or later we will face the fact that the area belonging to the old generation will be heavily fragmented, and the amount of memory for new objects will be insufficient , which will lead to the call of the “mark-sweep-compact” algorithm and stop the application (there is one more trick how to delay this event in time - about it further). Another challenge that leads to the emergence of “stop-the-world” pauses is labeling. “Mostly concurrent” GC conducts the labeling of living objects in two stages - the first stage includes marking simultaneously with the work of the streams, and is called the concurrent mark. The second stage is remarking (remark) - since during the time when the first stage passed, the application could modify the links or create new objects, it is necessary to check this. At this stage, the GC sets a “stop-the-world” pause and checks for what has changed. This approach allows reducing the total time of “stop-the-world” pauses with a small percentage of mutations, but it does not help much if a large number of objects are constantly being created and modified in our country.
I will give here a table with the most common GC:
“Monolithic” means that the entire generation must be cleaned per pass.
"In most cases, simultaneous" - mostly concurrent, simultaneous refers to the background, "working together with application threads."
Let's stop a little more on several:
Oracle HotSpot ParallelGC
GC for HotSpot by default. It uses the "monolithic", stop-the-world algorithm (Copying Collector) for the younger generation and the "monolithic", stop-the-world algorithm (Mark / Sweep / Compact) for the older generation.
Oracle HotSpot CMS
GC is trying to eliminate the pauses that occur when working with the older generation, as far as possible by simultaneous marking and cleaning, but without defragmentation. However, as soon as the memory area related to OG is highly fragmented, defragmentation is called with stop-the-world.
The CMS garbage collection cycle consists of several stages, the main stages are as follows:
· Initial marking (initial mark): the CMS starts with a very short stop-the-world pause, during which the garbage collector finds the so-called root references to objects created by the application
· Simultaneous marking (concurrent mark): during this stage, the CMS marks all objects reachable from the root objects, that is, all “living” objects that should not be deleted by the garbage collector. This stage is performed simultaneously with the operation of the application.
· Remarking (remark): since during the simultaneous labeling stage, application flows continued to work, and at this time they could create new objects and modify links, by the end of this stage there is no guarantee that all living objects were marked. To solve this problem, the CMS once again suspends the application and completes the labeling, checking all objects that were modified by user threads during the previous step. Since remarking can take quite a lot of time, on multiprocessor machines this stage is performed by several parallel threads.
· Simultaneous cleaning (concurrent sweep): upon completion of the re-marking stage, all living objects in the application were marked, and during the simultaneous cleaning stage, the CMS deletes all found garbage (all unchecked objects). This stage does not require the suspension of the application.
Thus, CMS divides all the work of cleaning OldGen into several parts, some of which can be performed simultaneously with the application, and thus avoids long stop-the-world pauses. At the same time, due to the peculiarities of the algorithm, the total amount of work performed by the CMS becomes larger compared to the sequential garbage collector (for example, because of the need for remarking), and as a result, when using the CMS, the overall performance of the application may slightly decrease.
IBM J9 optthruput does almost the same thing.
Oracle HotSpot G1GC (Garbage First)
Generation garbage collector, but the principle of operation is different. All heap is divided into regions of fixed size. A set of regions are dynamically generated and can be eden, survivor space or older generation (OG). If an object does not fit in one region, then it is stored in a set of contiguous regions and is called “humongous”. It is assumed that some regions are more popular than others. When performing a memory cleanup procedure, the following occurs:
1) Selected regions where GC will be held - all the younger generation and unpopular regions from the older generation, where there are no living objects
2) Remarking for catching new objects and modified links, stop-the-world is set for a short period of time
3) Copying to regions marked as “To”, due to this, partial “compression” occurs.
There is also a Remembered Set - information about the location of links to objects from a region, which allows you to use several independent regions in different parts of the memory, and to refuse the so-called free list. This GC works with large heap-ohms better than previous ones, and, in principle, can offer acceptable performance for heap-a size of 10-15GB. Nevertheless, the huge number of bugs, as well as the fact that over time G1 is still forced to resort to stop-the-world due to the highly fragmented popular regions, does not add to its appeal. Also a disadvantage of this GC is the reduction in maximum throughput compared to the other GC.
IBM J9 balanced does the same.
Azul C4
Of particular interest is this particular garbage collector, since in his description he declares the following:
“ A truly fully background, simultaneous garbage collector that uses its own C4 algorithm (Continuously Concurrent Compacting Collector), operated by Azul JVM. C4 simultaneously defragments both generations, young and older. Unlike other algorithms, it is not “simultaneous in most cases”, but actually works with application threads at the same time, i.e. stop-the-world is never called. C4 uses the Loaded Value Barrier (LVB) to test each link, and each modified link is trapped using the “self-healing” method. C4 guarantees that all links will be marked in one pass GC. It is also guaranteed that the objects will be moved, and the links to them will be modified simultaneously with the operation of the application, without interfering with its operation and without causing “stop-the-world” .
The following comparison charts with some current GC implementations are also included in the descriptions of this product:
By bandwidth:

By response time:

If throughput is observed a certain parity, and in most cases it is clear that Parallel GC works better, then on the graph showing the dependence of response time on the size of heap-a, you can see that Azul C4 certainly leads in all cases. However, it would be wrong to believe these graphs, just by looking at them, and not understanding the details, which could give us an understanding of where such a significant difference comes from compared to the "traditional" GC? In order to do this, it is necessary to disassemble the algorithm by which Azul C4 acts.
Above, I mentioned two main reasons leading to the appearance of “stop-the-world” pauses. This is the fragmentation of the memory area with the older generation and the labeling of living objects . If we do not defragment the memory, then sooner or later we will get “Out of memory”, if we defragment the memory simultaneously with the operation of the application, we will get incorrect data. In the case of marking, there is a danger of removing “living” objects from memory, which will then lead to reports of their inaccessibility.
To solve these problems, the Azul C4 garbage collection algorithm uses hardware emulation of the so-called “read barrier”. In Azul C4, it has the name LVB (Load Value Barrier), and it helps to guarantee the work of the garbage collector and the application in parallel mode.
Azul C4 also uses two generations - young and older, the memory occupied by these generations is defragmented simultaneously with the execution of the application. The figure below shows the main stages of cleaning garbage. There are three of them - Mark, Relocate, Remap . I would like to note that Remap and Mark can be executed at the same time. What happens at each stage?
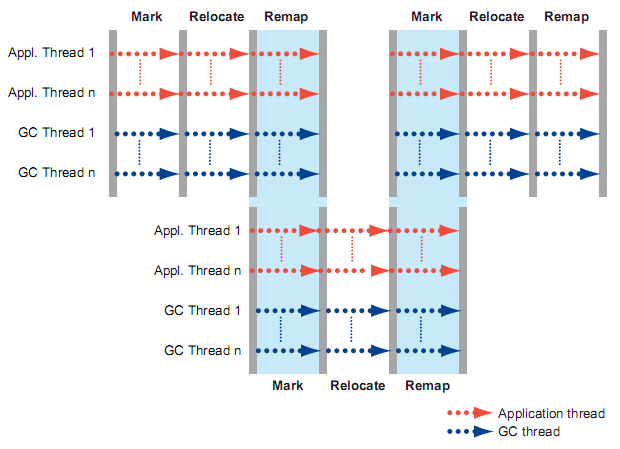
Mark
At this stage, all objects reachable from the root objects are marked in memory. Such objects are marked as “living”, all others are implied as “dead” and can be cleaned. It runs simultaneously with the operation of the application and does not cause a “stop-the-world” pause. In general, it is similar to the “concurrent mark” stage for CMS, but it has several important differences. First, in addition to labeling, Azul C4 also counts the number of “live” objects in each memory page. This information is used later to select pages for transfer and defragmentation in memory. Secondly, the Azul C4 algorithm tracks all references to live objects using the architecturally reserved NMT bit in 64-bit links. This bit, NMT (Not Marked Through), is intended to mark the reference as “marked through” if the GC “passed” it or, otherwise, “not marked through”. Thus, Azul C4 marks all accessible objects as “live”, and also all links that it “passed” as “marked through”. Once the Mark phase has begun, application flows trying to “pass” the link with the NMT bit set to “not marked through” will be intercepted by the LVB reading barrier. Hardware emulation of this barrier is aware of the function of the NMT bit and can ensure that application threads never access the link marked as “not marked through”. If any of the application's threads try to do this, the processor will trigger a GC trap. The interrupt will handle the situation that caused it in the following way: put the link in the GC list, put the NMT bit in “marked through” and check the NMT bit for the object from which the correctness link was loaded (must be “marked through”). After the interrupt has been processed, the application threads will resume. Using this mechanism allows you to mark all "live" objects in one pass, without causing re-marking (as CMS does) and the "stop-the-world" pause. Also, the elimination of the cause of the interruption, while processing this interruption, has the effect of “self-treatment”, i.e. does not allow the same reason to cause an interruption again, which guarantees the final and predictable amount of marking work.
In general, the interrupt mechanism allows marking of “living” objects in one pass, and without causing a “stop-the-world” pause.
Relocate
At this stage, the GC frees the memory occupied by the "dead" objects. At the same time, he transfers the “living” objects to another area of memory, thereby defragmenting and compacting it. For greater efficiency, Azul C4 uses the number of objects counted at the last stage (Mark) in order to be the first to clear pages in which the number of dead objects is relatively large. Since there are few “living” objects in these pages, their transfer takes a short amount of time, at the same time, allowing you to free up large amounts of memory in the first place, making them accessible to the application. The stage ends when the memory occupied by the "dead" objects is completely cleared. At the same time, “live” objects are transferred only from highly fragmented pages.

At the beginning of the stage, using the memory protection mechanism in order to restrict access to certain memory pages, the garbage collector begins to transfer “live” objects to other memory pages. Information about the initial and new address is stored in a special array with “forwarding pointers” (Forwarding Pointers), rendered separately from the “From” space. Once all the “living” objects are transferred, the physical memory becomes available to the application threads. LVB is used to determine the access attempts of streams to memory pages in which the process of transferring "live" objects or redefining addresses for this object occurs. It intercepts the circulation of threads and compares the value of the link with its existing references in the Translation Look-aside Buffer (TLS) buffer. If the value matches the link for which the transfer process is currently taking place, the interruption is called. This interrupt performs the following actions: using information located in the Forwarding Pointers array, it is determined whether the object has already been moved or not. If the object has already been moved to a new page of memory, then a new link to the object is returned to the stream, and the address for the link to the object from which it was loaded is redefined in order to use the new link in the future. In case the object is not yet moved, the interrupt moves this object, without waiting for the garbage collector to process the memory page where the object is located. After that, work flow resumes. Using the same effect of "self-treatment", as in the previous stage, makes it possible to complete the stage of movement in deterministic terms. Also, the relocation stage can be completed forcibly if the garbage collector decides that now it is more efficient to perform the labeling stage than to continue the relocation stage of objects in memory.
Considering this stage, we can say that this behavior of the algorithm and the interrupt mechanism ensures that the threads will not wait until the garbage collector finishes working with moving and re-identifying addresses, thereby allowing the garbage collector to work simultaneously with the threads and not call the “stop” the-world pause.
Remap
This stage completes the redefinition of addresses for all moved object references and guarantees the absence of references to the old location in the heap for moved objects. These links may exist at the beginning of the override stage, since the heap may contain links to objects that were not visited by the threads after they were moved. When the address rewrite phase is completed, the memory protection mechanism is disabled, and the Forwarding Pointers array is no longer needed. Address redefinition is performed as follows: all “live” objects in heap-e are scanned and links are redefined for them if they point to objects moved to new memory pages. This stage coincides with the marking stage, they are performed simultaneously, i.e. the labeling process finds live objects and marks them, and also sets the NMT bit as “marked through”. At the same time, the address reassignment process finds references to the moved objects and redefines them according to the new addresses. Throughout the entire process of marking and address rewriting, the “barrier to reading” mechanism continues to “catch” application threads that access transferred objects, causing an interrupt that returns a new location address for the object to the stream.
Thus, Azul C4 can simultaneously mark and re-define addresses without causing a “stop-the-world” pause.
Summarizing the theoretical description of the Azul C4 algorithm, we can say that it really allows the application to work simultaneously with the garbage collector. The LVB mechanism somewhat reduces the overall throughput of the JVM, but it stabilizes the response time at a minimum level, eliminating the “stop-the-world” pause completely. For companies that specialize in providing services via the Internet and applications where response time is critical for a business, Azul C4 looks like the most attractive JVM.
Despite all this, the theory must be confirmed by practice. In life, Azul JVM is supplied both as a piece of hardware and as a virtual machine. The hardware platform Azul Vega 3 is already well established in financial companies. Virtual implementation of Azul JVM is becoming increasingly popular in the world, partly due to the fact that it can be deployed on any x86 hardware, partly due to the fact that the tasks assigned to Java-based applications are becoming more serious. By the way, Azul C4 is not the only advantage in Azul JVM, there are a few differences that distinguish Azul from competitors. A detailed description of these advantages will take as much space as this article takes - so it is better to leave them for a separate article, where you can consider the Azul JVM in general. If by name, then this is DirectPathVMTM, Optimistic Thread Concurrency, monitoring and profiling of application execution.
On the Azul Systems website you can see a few dozen cases from the life where the advantages of Azul have been applied.
Companies using Azul JVM
From personal practice, I can provide an example of implementing Azul JVM in the life of a large client - trading company:

JVM configuration:
To summarize the above, we can say that the concept implemented in Azul C4 really works in real life, allows you to have a heap of up to 1 Terabyte and eliminate the headache associated with adjusting the heap size and GC tuning, while achieve a stable and minimal application response time.
Technical description of the Azul C4 algorithm
One of the most frequently used platforms with automatic memory management mechanisms is Java. But, automatic memory management has brought not only comfort to the hard work of programmers, but also its own shortcomings, which we have to face more and more often. Modern multi-user applications that can handle a huge flow of transactions require significant hardware resources, the size of which was previously difficult to even imagine. However, it’s not about the size of these resources, the fact is that the garbage collector that exists in most modern JVMs cannot work efficiently with large amounts of memory.
The garbage collector automates the process of clearing the memory and saves the programmer from many headaches, introducing instead one big problem - which GC mechanism to use and what size of heap will be the most optimal? If you make more than necessary heap and encounter constant “stop-the-world” pauses, make less than necessary, then “Out of memory” errors will appear. All this is complicated by the fact that with an increase in the heap-a size, the garbage collector needs more time to clear the memory and defragment it. This leads to the fact that when using a heap-a of more than 2-4GB, the pauses become critical for the business and take a few seconds, or even minutes, during which all threads have to wait until the memory cleaning process is completed. The response time increases and becomes unstable, bandwidth drops - for large web portals, companies working in the field of e-commerce or business-critical applications, this is unacceptable.
There are several ways to deal with a large heap-a, one of which is deploying a few dozen or hundreds of copies or taking storage of data outside the heap-a area. I do not want to touch them in this article, leaving the future discussion. I would like to note that these methods are quite expensive, since they imply a lot of developers and administrators work necessary to bring them to life. We will remain within the framework of the JVM, without inventing "crutches" and workaround solutions, the support of which then takes time, nerves and money.
')
It's no secret that GC in common JVM has several modes of operation, and some of them are designed precisely to reduce the so-called “stop-the-world” pauses, during which all threads stop. Nevertheless, it is impossible to exclude these pauses for technological reasons, with one exception, which I will discuss below. This means that even at best, the threads will still have to wait until the GC finishes clearing the memory. More and more, this becomes unacceptable - business cannot wait.
In this article I will try to conduct a brief overview of the most common JVMs, as well as talk about the methods proposed by these JVMs for the effective work of GC with large heap. I think resource visitors are familiar with the concept of heap in the JVM and know what it is. It also makes no sense to explain about the generation of objects, one has only to note that it is assumed that the objects belonging to the younger generation, often become unattainable and are removed from memory. I will give a drawing heap-a:
The main algorithms that use GC in their work:
Mark-Sweep-Compact
Mark: marks unused objects.
“Sweep”: these objects are deleted from memory.
“Compact”: objects are “compacted”, occupying free slots, which frees up space in case you need to create a “large” object.
Throughout all three steps, there is a “stop-the-world” pause.
Copying collector
Performs all three actions in a single pass, using the “from” and “to” areas. This happens as follows: at the beginning of work, one of the survivor spaces, “To”, is empty, and the other, “From”, contains objects that survived previous assemblies. The garbage collector searches for live objects in Eden and copies them to To space, and then copies live and “young” (that is, not still surviving a given number of garbage collections, tenuring threshold) objects from From space. Old objects from From space are moved to the Old generation. After assembling, From space and To space change roles, the Eden area becomes empty, and the number of objects in the Old generation increases. If in the process of copying live objects To space is full, then the remaining live objects from Eden and From space, which did not have enough space in To space, will be moved to the Old generation, regardless of how many garbage collections they have experienced.
Since using this algorithm, the garbage collector simply copies all living objects from one memory area to another, such a garbage collector is called copying. Obviously, for a copying garbage collector to work, an application should always have a free memory area into which living objects will be copied, and such an algorithm can be used for memory areas that are relatively small relative to the total memory size of the application.
The main drawback of existing GCs is the need for pauses. These pauses are the result of inevitable events due to memory fragmentation. Even if we use the so-called "mostly concurrent" (in most cases simultaneous) garbage collection algorithms, anyway, sooner or later we will face the fact that the area belonging to the old generation will be heavily fragmented, and the amount of memory for new objects will be insufficient , which will lead to the call of the “mark-sweep-compact” algorithm and stop the application (there is one more trick how to delay this event in time - about it further). Another challenge that leads to the emergence of “stop-the-world” pauses is labeling. “Mostly concurrent” GC conducts the labeling of living objects in two stages - the first stage includes marking simultaneously with the work of the streams, and is called the concurrent mark. The second stage is remarking (remark) - since during the time when the first stage passed, the application could modify the links or create new objects, it is necessary to check this. At this stage, the GC sets a “stop-the-world” pause and checks for what has changed. This approach allows reducing the total time of “stop-the-world” pauses with a small percentage of mutations, but it does not help much if a large number of objects are constantly being created and modified in our country.
I will give here a table with the most common GC:
“Monolithic” means that the entire generation must be cleaned per pass.
"In most cases, simultaneous" - mostly concurrent, simultaneous refers to the background, "working together with application threads."
| Java Virtual Machine | Collector Name | Young generation | Old generation |
| Oracle HotSpot | ParallelGC | Monolithic, stop the world, copying | Monolithic, stop-the-world, Mark / Sweep / Compact |
| Oracle HotSpot | CMS | Monolithic, stop the world, copying | In most cases, simultaneous, without "compression", defragmenting causing stop-the-world |
| Oracle HotSpot | G1 (Garbage First) | Monolithic, stop the world, copying | In most cases, simultaneous, with the "compression" of regions on the basis of popularity, defragmenting causing stop-the-world |
| Oracle JRockit | Dynamic Garbage Collector | Monolithic, stop-the-world, copying | Simultaneous or parallel Mark / Sweep, with the "compression" of regions on the basis of popularity, defragmenting causing stop-the-world |
| Ibm j9 | Balanced | Monolithic, stop-the-world, copying | In most cases, simultaneous, with the "compression" of regions on the basis of popularity, defragmenting causing stop-the-world |
| Ibm j9 | optthruput | Monolithic, stop-the-world, copying | Parallel Mark / Sweep, defragmenting causing stop-the-world |
| Azul | C4 (Continuously Concurrent Compacting Collector) | Simultaneous, with defragmentation | Simultaneous, with defragmentation |
Let's stop a little more on several:
Oracle HotSpot ParallelGC
GC for HotSpot by default. It uses the "monolithic", stop-the-world algorithm (Copying Collector) for the younger generation and the "monolithic", stop-the-world algorithm (Mark / Sweep / Compact) for the older generation.
Oracle HotSpot CMS
GC is trying to eliminate the pauses that occur when working with the older generation, as far as possible by simultaneous marking and cleaning, but without defragmentation. However, as soon as the memory area related to OG is highly fragmented, defragmentation is called with stop-the-world.
The CMS garbage collection cycle consists of several stages, the main stages are as follows:
· Initial marking (initial mark): the CMS starts with a very short stop-the-world pause, during which the garbage collector finds the so-called root references to objects created by the application
· Simultaneous marking (concurrent mark): during this stage, the CMS marks all objects reachable from the root objects, that is, all “living” objects that should not be deleted by the garbage collector. This stage is performed simultaneously with the operation of the application.
· Remarking (remark): since during the simultaneous labeling stage, application flows continued to work, and at this time they could create new objects and modify links, by the end of this stage there is no guarantee that all living objects were marked. To solve this problem, the CMS once again suspends the application and completes the labeling, checking all objects that were modified by user threads during the previous step. Since remarking can take quite a lot of time, on multiprocessor machines this stage is performed by several parallel threads.
· Simultaneous cleaning (concurrent sweep): upon completion of the re-marking stage, all living objects in the application were marked, and during the simultaneous cleaning stage, the CMS deletes all found garbage (all unchecked objects). This stage does not require the suspension of the application.
Thus, CMS divides all the work of cleaning OldGen into several parts, some of which can be performed simultaneously with the application, and thus avoids long stop-the-world pauses. At the same time, due to the peculiarities of the algorithm, the total amount of work performed by the CMS becomes larger compared to the sequential garbage collector (for example, because of the need for remarking), and as a result, when using the CMS, the overall performance of the application may slightly decrease.
IBM J9 optthruput does almost the same thing.
Oracle HotSpot G1GC (Garbage First)
Generation garbage collector, but the principle of operation is different. All heap is divided into regions of fixed size. A set of regions are dynamically generated and can be eden, survivor space or older generation (OG). If an object does not fit in one region, then it is stored in a set of contiguous regions and is called “humongous”. It is assumed that some regions are more popular than others. When performing a memory cleanup procedure, the following occurs:
1) Selected regions where GC will be held - all the younger generation and unpopular regions from the older generation, where there are no living objects
2) Remarking for catching new objects and modified links, stop-the-world is set for a short period of time
3) Copying to regions marked as “To”, due to this, partial “compression” occurs.
There is also a Remembered Set - information about the location of links to objects from a region, which allows you to use several independent regions in different parts of the memory, and to refuse the so-called free list. This GC works with large heap-ohms better than previous ones, and, in principle, can offer acceptable performance for heap-a size of 10-15GB. Nevertheless, the huge number of bugs, as well as the fact that over time G1 is still forced to resort to stop-the-world due to the highly fragmented popular regions, does not add to its appeal. Also a disadvantage of this GC is the reduction in maximum throughput compared to the other GC.
IBM J9 balanced does the same.
Azul C4
Of particular interest is this particular garbage collector, since in his description he declares the following:
“ A truly fully background, simultaneous garbage collector that uses its own C4 algorithm (Continuously Concurrent Compacting Collector), operated by Azul JVM. C4 simultaneously defragments both generations, young and older. Unlike other algorithms, it is not “simultaneous in most cases”, but actually works with application threads at the same time, i.e. stop-the-world is never called. C4 uses the Loaded Value Barrier (LVB) to test each link, and each modified link is trapped using the “self-healing” method. C4 guarantees that all links will be marked in one pass GC. It is also guaranteed that the objects will be moved, and the links to them will be modified simultaneously with the operation of the application, without interfering with its operation and without causing “stop-the-world” .
The following comparison charts with some current GC implementations are also included in the descriptions of this product:
By bandwidth:
By response time:
If throughput is observed a certain parity, and in most cases it is clear that Parallel GC works better, then on the graph showing the dependence of response time on the size of heap-a, you can see that Azul C4 certainly leads in all cases. However, it would be wrong to believe these graphs, just by looking at them, and not understanding the details, which could give us an understanding of where such a significant difference comes from compared to the "traditional" GC? In order to do this, it is necessary to disassemble the algorithm by which Azul C4 acts.
Above, I mentioned two main reasons leading to the appearance of “stop-the-world” pauses. This is the fragmentation of the memory area with the older generation and the labeling of living objects . If we do not defragment the memory, then sooner or later we will get “Out of memory”, if we defragment the memory simultaneously with the operation of the application, we will get incorrect data. In the case of marking, there is a danger of removing “living” objects from memory, which will then lead to reports of their inaccessibility.
To solve these problems, the Azul C4 garbage collection algorithm uses hardware emulation of the so-called “read barrier”. In Azul C4, it has the name LVB (Load Value Barrier), and it helps to guarantee the work of the garbage collector and the application in parallel mode.
Azul C4 also uses two generations - young and older, the memory occupied by these generations is defragmented simultaneously with the execution of the application. The figure below shows the main stages of cleaning garbage. There are three of them - Mark, Relocate, Remap . I would like to note that Remap and Mark can be executed at the same time. What happens at each stage?
Mark
At this stage, all objects reachable from the root objects are marked in memory. Such objects are marked as “living”, all others are implied as “dead” and can be cleaned. It runs simultaneously with the operation of the application and does not cause a “stop-the-world” pause. In general, it is similar to the “concurrent mark” stage for CMS, but it has several important differences. First, in addition to labeling, Azul C4 also counts the number of “live” objects in each memory page. This information is used later to select pages for transfer and defragmentation in memory. Secondly, the Azul C4 algorithm tracks all references to live objects using the architecturally reserved NMT bit in 64-bit links. This bit, NMT (Not Marked Through), is intended to mark the reference as “marked through” if the GC “passed” it or, otherwise, “not marked through”. Thus, Azul C4 marks all accessible objects as “live”, and also all links that it “passed” as “marked through”. Once the Mark phase has begun, application flows trying to “pass” the link with the NMT bit set to “not marked through” will be intercepted by the LVB reading barrier. Hardware emulation of this barrier is aware of the function of the NMT bit and can ensure that application threads never access the link marked as “not marked through”. If any of the application's threads try to do this, the processor will trigger a GC trap. The interrupt will handle the situation that caused it in the following way: put the link in the GC list, put the NMT bit in “marked through” and check the NMT bit for the object from which the correctness link was loaded (must be “marked through”). After the interrupt has been processed, the application threads will resume. Using this mechanism allows you to mark all "live" objects in one pass, without causing re-marking (as CMS does) and the "stop-the-world" pause. Also, the elimination of the cause of the interruption, while processing this interruption, has the effect of “self-treatment”, i.e. does not allow the same reason to cause an interruption again, which guarantees the final and predictable amount of marking work.
In general, the interrupt mechanism allows marking of “living” objects in one pass, and without causing a “stop-the-world” pause.
Relocate
At this stage, the GC frees the memory occupied by the "dead" objects. At the same time, he transfers the “living” objects to another area of memory, thereby defragmenting and compacting it. For greater efficiency, Azul C4 uses the number of objects counted at the last stage (Mark) in order to be the first to clear pages in which the number of dead objects is relatively large. Since there are few “living” objects in these pages, their transfer takes a short amount of time, at the same time, allowing you to free up large amounts of memory in the first place, making them accessible to the application. The stage ends when the memory occupied by the "dead" objects is completely cleared. At the same time, “live” objects are transferred only from highly fragmented pages.
At the beginning of the stage, using the memory protection mechanism in order to restrict access to certain memory pages, the garbage collector begins to transfer “live” objects to other memory pages. Information about the initial and new address is stored in a special array with “forwarding pointers” (Forwarding Pointers), rendered separately from the “From” space. Once all the “living” objects are transferred, the physical memory becomes available to the application threads. LVB is used to determine the access attempts of streams to memory pages in which the process of transferring "live" objects or redefining addresses for this object occurs. It intercepts the circulation of threads and compares the value of the link with its existing references in the Translation Look-aside Buffer (TLS) buffer. If the value matches the link for which the transfer process is currently taking place, the interruption is called. This interrupt performs the following actions: using information located in the Forwarding Pointers array, it is determined whether the object has already been moved or not. If the object has already been moved to a new page of memory, then a new link to the object is returned to the stream, and the address for the link to the object from which it was loaded is redefined in order to use the new link in the future. In case the object is not yet moved, the interrupt moves this object, without waiting for the garbage collector to process the memory page where the object is located. After that, work flow resumes. Using the same effect of "self-treatment", as in the previous stage, makes it possible to complete the stage of movement in deterministic terms. Also, the relocation stage can be completed forcibly if the garbage collector decides that now it is more efficient to perform the labeling stage than to continue the relocation stage of objects in memory.
Considering this stage, we can say that this behavior of the algorithm and the interrupt mechanism ensures that the threads will not wait until the garbage collector finishes working with moving and re-identifying addresses, thereby allowing the garbage collector to work simultaneously with the threads and not call the “stop” the-world pause.
Remap
This stage completes the redefinition of addresses for all moved object references and guarantees the absence of references to the old location in the heap for moved objects. These links may exist at the beginning of the override stage, since the heap may contain links to objects that were not visited by the threads after they were moved. When the address rewrite phase is completed, the memory protection mechanism is disabled, and the Forwarding Pointers array is no longer needed. Address redefinition is performed as follows: all “live” objects in heap-e are scanned and links are redefined for them if they point to objects moved to new memory pages. This stage coincides with the marking stage, they are performed simultaneously, i.e. the labeling process finds live objects and marks them, and also sets the NMT bit as “marked through”. At the same time, the address reassignment process finds references to the moved objects and redefines them according to the new addresses. Throughout the entire process of marking and address rewriting, the “barrier to reading” mechanism continues to “catch” application threads that access transferred objects, causing an interrupt that returns a new location address for the object to the stream.
Thus, Azul C4 can simultaneously mark and re-define addresses without causing a “stop-the-world” pause.
Summarizing the theoretical description of the Azul C4 algorithm, we can say that it really allows the application to work simultaneously with the garbage collector. The LVB mechanism somewhat reduces the overall throughput of the JVM, but it stabilizes the response time at a minimum level, eliminating the “stop-the-world” pause completely. For companies that specialize in providing services via the Internet and applications where response time is critical for a business, Azul C4 looks like the most attractive JVM.
Despite all this, the theory must be confirmed by practice. In life, Azul JVM is supplied both as a piece of hardware and as a virtual machine. The hardware platform Azul Vega 3 is already well established in financial companies. Virtual implementation of Azul JVM is becoming increasingly popular in the world, partly due to the fact that it can be deployed on any x86 hardware, partly due to the fact that the tasks assigned to Java-based applications are becoming more serious. By the way, Azul C4 is not the only advantage in Azul JVM, there are a few differences that distinguish Azul from competitors. A detailed description of these advantages will take as much space as this article takes - so it is better to leave them for a separate article, where you can consider the Azul JVM in general. If by name, then this is DirectPathVMTM, Optimistic Thread Concurrency, monitoring and profiling of application execution.
On the Azul Systems website you can see a few dozen cases from the life where the advantages of Azul have been applied.
Companies using Azul JVM
From personal practice, I can provide an example of implementing Azul JVM in the life of a large client - trading company:
JVM configuration:
| Native configuration | Azul Configuration |
| -Xms2g -Xmx2g -XX: + UseConcMarkSweepGC -XX: + UseParNewGC -XX: TargetSurvivorRatio = 80 -XX: CMSInitiatingOccupancyFraction = 85 -XX: SurvivorRatio = 8 -XX: MaxNewSize = 320m -XX: NewSize = 320m -XX: MaxTenuringThreshold = 10 | -Xms3g –Xmx3g |
To summarize the above, we can say that the concept implemented in Azul C4 really works in real life, allows you to have a heap of up to 1 Terabyte and eliminate the headache associated with adjusting the heap size and GC tuning, while achieve a stable and minimal application response time.
Technical description of the Azul C4 algorithm
Source: https://habr.com/ru/post/148322/
All Articles