Introduction to Javascript Source Maps
Have you ever thought how it would be great if you could easily read and debug the minified javascript code in the production environment in one file and even debug it without affecting performance? Now this is possible if you use a piece called source maps .
In short, this is a way to associate a minified / merged file with the files from which it came out. During the build for the combat environment, in addition to minifying and merging files, a mapper file is also generated that contains information about the source files. When a call is made to a specific place in the minified file, a search is made in the mapper, which calculates a string and a character in the source file. Developer Tools (WebKit nightly builds or Google Chrome Canary) can parse this file to automatically and transparently replace files, as if working with source files. At the time of writing (the original article - approx. Transl. ) Firefox blocked the development of support for Source Map. Learn more at the MozillaWiki Source Map .
An example is the correct location definition in the source code.
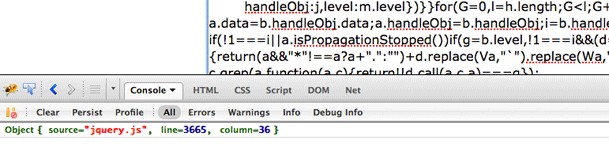
In this example, you can right-click anywhere in the textarea and select the item “Get original location”. In this case, the mapper file will be accessed with the transfer of the line and character number in the minified code, and the corresponding piece of code from the source file will be shown. The line number and symbol number in the source file and other interesting information will be displayed in the console.
')
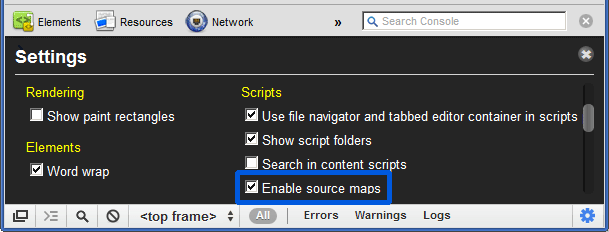
Before watching the next example, you need to activate the source maps view in Chrome Canary or WebKit nightly, for this, activate the item “Enable source maps” in the properties (see screenshot)
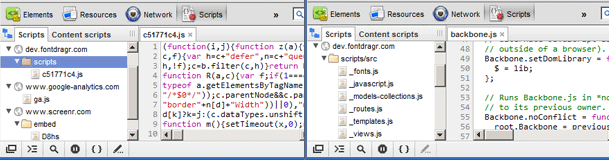
We continue. The previous example was interesting, but how can it be used? Go to dev.fontdragr.com with your Google Chrome browser and you will see that the javascripts on the page are not compiled and you can watch individual js-files. This is all due to the use of the mapper, and in fact the code on the page is compiled. All errors, outputs to the log and breakpoints will map to the source code, and debugging the code will be very convenient. As a result, you can work with the production site as a test.
Example - look in the console on fontdragr.com
Now, mapping only works between source files and a compressed / merged version, but there is talk of mapping for languages compiled into JavaScript (for example, CoffeeScript), and even support for CSS preprocessors, such as SASS and LESS.
In the future, we could easily use almost any language, as if it were natively supported by the browser:
Check out the screencast in which CoffeeScript is debugged in the experimental build of the Firefox console:
Google Web Toolkit (GWT) recently added support for Source Maps and Ray Cromwell from GWT made an excellent screencast showing how Source Map works in action.
Another example uses the Google Traceur library, which allows you to write to ES6 (ECMAScript 6) and compile to ES3-compatible code. The Traceur compiler also generates a source map. Look at an example of using the features of ES6 (classes and traits) as if they were natively supported by the browser. The textarea in the example also allows you to write ES6 code that will be compiled on the fly in ES3 and a mapper file will also be created.
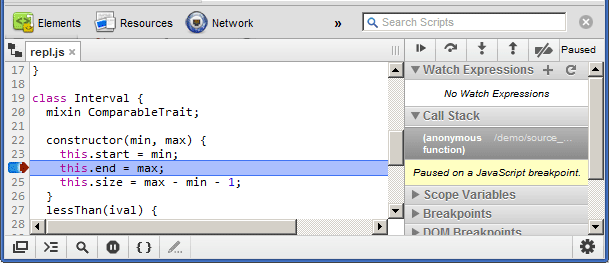
Example - you can write code on ES6 and immediately look in the debugger
So far, the only compiler / minifier with Source Map support is the Closure compiler (as generated by the mapper, as described below, it is written below). When minifying JavaScript, a file mapper will also be created. While Closure compiler does not add to the end of the file a special comment for Google Chrome Canary dev tools that the file mapper is available:
Such a comment allows the browser to search for the right place in the source file using the file mapper. If you don’t like the idea of using weird comments, you can add a special header to the compiled file:
Like the comment, it will tell the client where to find the mapper for this file. Using the title also allows you to work with languages that do not support single-line comments.
The file mapper will be downloaded only if the property is enabled and the console is open. And of course, you will need to upload the source files so that they are accessible by the paths specified in the mapper.
As mentioned above, you will need a Closure compiler for minifikatsi, splicing and generating a mapper file for the necessary JavaScript files. To do this, run the command:
The required flags are
To better understand the Source Map, take for example a small file mapper and analyze in detail how the "addressing" is arranged. Below is a slightly modified example from the V3 spec :
You may notice that this is a regular object literal containing all the necessary information:
Initially, the specification described a very detailed derivation of all dependencies, which made the file mapper 10 times larger than the generated file. The second version reduced the file size by half, and the third version reduced it again by half. Now for the 133kB file ~ 300kB file mapper is generated. How did you manage to achieve such a reduction and still be able to track complex dependencies?
Used VLQ (Variable Length Quantity) and Base64-coding. The
As mentioned earlier, each segment can be 1, 4 or five VLQ. The diagram shows 4 VLQs with one continuation bit. Let us analyze it in more detail and show how the mapper calculates the position in the source file. A segment consists of five things:
( comment perev .: not mastered to the end to translate this part of the article, you can fully read the original; if you want to help - write, I will be grateful )
The specification talks about potential problems with implementing XSS when using the Source Map. You can get rid of it by writing at the beginning of your map file "
As you can see, the first three characters are truncated and they are checked for compliance with the non-valid code specified in the specification, and in this case everything is cut to the next newline character.
Although these two agreements are not yet included in the Source Map specification, they can seriously simplify work with
The first helper is very similar to the
Example - eval code passed with generated name
Another helper allows you to name anonymous functions using the
Example - names for anonymous functions via
When profiling, beautiful names will be displayed instead of
By the time this article was written, the assignment of names to code executed via
There is a very long discussion about Source Map support in CoffeeScript .
UglifyJS also has a Source Map support ticket .
You can help if you take part in the discussion and give an opinion on the need for support of the Source Map. The more tools that support this technology, the easier it will be to work, so demand its support in your favorite OpenSource project.
There is one trouble with using Source Map for normal debugging. The problem is that when you try to check the value of an argument or a variable defined in the context of the source file, the context will not return anything, because he doesn't really exist. We need some kind of reverse mapping to check the value of the corresponding variable / argument in the minified code and match it to the source code.
The problem is solved, and with proper attention to the Source Map may appear even more interesting of its application.
Source Map is a powerful tool for the developer. It allows you to keep the production code as compressed as possible, but at the same time allows you to debug it. It is also useful for novice developers to view code written by experienced developers, in order to learn how to properly structure and write their code without having to wade through minified code. What are you waiting for? Generate a Source Map for your project!
In short, this is a way to associate a minified / merged file with the files from which it came out. During the build for the combat environment, in addition to minifying and merging files, a mapper file is also generated that contains information about the source files. When a call is made to a specific place in the minified file, a search is made in the mapper, which calculates a string and a character in the source file. Developer Tools (WebKit nightly builds or Google Chrome Canary) can parse this file to automatically and transparently replace files, as if working with source files. At the time of writing (the original article - approx. Transl. ) Firefox blocked the development of support for Source Map. Learn more at the MozillaWiki Source Map .
An example is the correct location definition in the source code.
In this example, you can right-click anywhere in the textarea and select the item “Get original location”. In this case, the mapper file will be accessed with the transfer of the line and character number in the minified code, and the corresponding piece of code from the source file will be shown. The line number and symbol number in the source file and other interesting information will be displayed in the console.
')
Real use
Before watching the next example, you need to activate the source maps view in Chrome Canary or WebKit nightly, for this, activate the item “Enable source maps” in the properties (see screenshot)
We continue. The previous example was interesting, but how can it be used? Go to dev.fontdragr.com with your Google Chrome browser and you will see that the javascripts on the page are not compiled and you can watch individual js-files. This is all due to the use of the mapper, and in fact the code on the page is compiled. All errors, outputs to the log and breakpoints will map to the source code, and debugging the code will be very convenient. As a result, you can work with the production site as a test.
Example - look in the console on fontdragr.com
Why do we need Source Maps?
Now, mapping only works between source files and a compressed / merged version, but there is talk of mapping for languages compiled into JavaScript (for example, CoffeeScript), and even support for CSS preprocessors, such as SASS and LESS.
In the future, we could easily use almost any language, as if it were natively supported by the browser:
- CoffeeScript
- ECMAScript 6 and above
- SASS / LESS, etc.
- Virtually any language that compiles to javascript
Check out the screencast in which CoffeeScript is debugged in the experimental build of the Firefox console:
Google Web Toolkit (GWT) recently added support for Source Maps and Ray Cromwell from GWT made an excellent screencast showing how Source Map works in action.
Another example uses the Google Traceur library, which allows you to write to ES6 (ECMAScript 6) and compile to ES3-compatible code. The Traceur compiler also generates a source map. Look at an example of using the features of ES6 (classes and traits) as if they were natively supported by the browser. The textarea in the example also allows you to write ES6 code that will be compiled on the fly in ES3 and a mapper file will also be created.
Example - you can write code on ES6 and immediately look in the debugger
How it works?
So far, the only compiler / minifier with Source Map support is the Closure compiler (as generated by the mapper, as described below, it is written below). When minifying JavaScript, a file mapper will also be created. While Closure compiler does not add to the end of the file a special comment for Google Chrome Canary dev tools that the file mapper is available:
//@ sourceMappingURL=/path/to/file.js.map Such a comment allows the browser to search for the right place in the source file using the file mapper. If you don’t like the idea of using weird comments, you can add a special header to the compiled file:
X-SourceMap: /path/to/file.js.map Like the comment, it will tell the client where to find the mapper for this file. Using the title also allows you to work with languages that do not support single-line comments.
The file mapper will be downloaded only if the property is enabled and the console is open. And of course, you will need to upload the source files so that they are accessible by the paths specified in the mapper.
How to generate a file mapper?
As mentioned above, you will need a Closure compiler for minifikatsi, splicing and generating a mapper file for the necessary JavaScript files. To do this, run the command:
java -jar compiler.jar \ --js script.js \ --create_source_map ./script-min.js.map \ --source_map_format=V3 \ --js_output_file script-min.js The required flags are
--create_source_map and --source_map_format . The latter is needed because By default, the mapper is created in V2 format, and we need V3.Inside Source Map
To better understand the Source Map, take for example a small file mapper and analyze in detail how the "addressing" is arranged. Below is a slightly modified example from the V3 spec :
{ version : 3, file: "out.js", sourceRoot : "", sources: ["foo.js", "bar.js"], names: ["src", "maps", "are", "fun"], mappings: "AAgBC,SAAQ,CAAEA" } You may notice that this is a regular object literal containing all the necessary information:
- Version mapper
- Name of minified / merged file for production
sourceRootallowssourceRootto add a prefix to the path to the source filessourcescontains source file names.namescontains all real variable / function names from the resulting file.- and
mappingsare the corresponding minified names.
BASE64 VLQ or how to make the Source Map small
Initially, the specification described a very detailed derivation of all dependencies, which made the file mapper 10 times larger than the generated file. The second version reduced the file size by half, and the third version reduced it again by half. Now for the 133kB file ~ 300kB file mapper is generated. How did you manage to achieve such a reduction and still be able to track complex dependencies?
Used VLQ (Variable Length Quantity) and Base64-coding. The
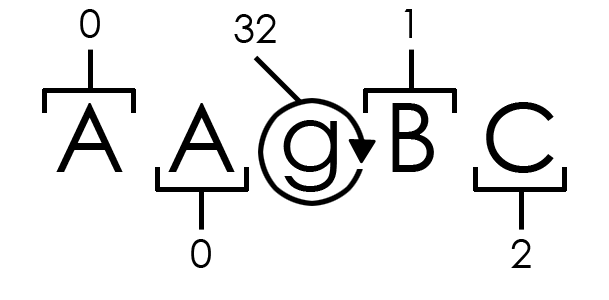
mappings property is one very large string. Inside this line, a semicolon (;) separates the line numbers in the generated file. Inside the resulting string, commas are used to separate code segments. Each of the segments is 1, 4 or 5 VLQ-fields. Some may be longer due to the continuation bit. Each segment is based on the previous one, which helps to reduce the file size.As mentioned earlier, each segment can be 1, 4 or five VLQ. The diagram shows 4 VLQs with one continuation bit. Let us analyze it in more detail and show how the mapper calculates the position in the source file. A segment consists of five things:
- The character number in the generated file.
- Original file
- Line number in source file
- Symbol number in source file
- Original name (if any)
( comment perev .: not mastered to the end to translate this part of the article, you can fully read the original; if you want to help - write, I will be grateful )
Potential problems with XSSI
The specification talks about potential problems with implementing XSS when using the Source Map. You can get rid of it by writing at the beginning of your map file "
)]} " to make this js file invalid and cause an error. WebKit dev tools already know how to bar it: if (response.slice(0, 3) === ")]}") { response = response.substring(response.indexOf('\n')); } As you can see, the first three characters are truncated and they are checked for compliance with the non-valid code specified in the specification, and in this case everything is cut to the next newline character.
@sourceURL and displayName in action: eval and anonymous functions
Although these two agreements are not yet included in the Source Map specification, they can seriously simplify work with
eval and anonymous functions.The first helper is very similar to the
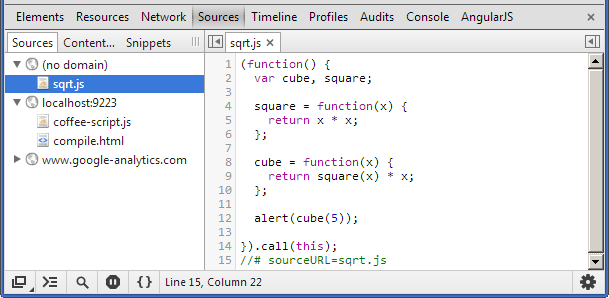
//@ sourceMappingURL and is generally mentioned in the specification (V3). By including this special comment in the code, which will then be executed via eval , you can call it eval , which will give them more logical names when working in the console. Below is a simple example using the CoffeeScript compiler:Example - eval code passed with generated name
Another helper allows you to name anonymous functions using the
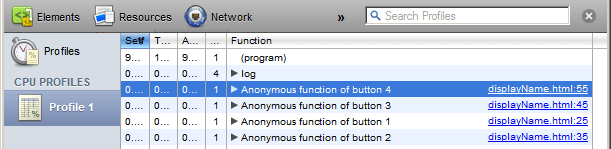
displayName property specified in the context of this function. View this example to see the displayName in action.Example - names for anonymous functions via
displayName (WebKit NIghtly only)When profiling, beautiful names will be displayed instead of
(anonymous function) . But most likely the displayName will not be included in the final build of Google Chrome. Although there is still hope, they also suggest renaming the property to debugName .By the time this article was written, the assignment of names to code executed via
eval is supported only by Firefox and Google Chrome. The displayName property is available only in Google Chrome nightly builds.Join
There is a very long discussion about Source Map support in CoffeeScript .
UglifyJS also has a Source Map support ticket .
You can help if you take part in the discussion and give an opinion on the need for support of the Source Map. The more tools that support this technology, the easier it will be to work, so demand its support in your favorite OpenSource project.
Source Map is not perfect
There is one trouble with using Source Map for normal debugging. The problem is that when you try to check the value of an argument or a variable defined in the context of the source file, the context will not return anything, because he doesn't really exist. We need some kind of reverse mapping to check the value of the corresponding variable / argument in the minified code and match it to the source code.
The problem is solved, and with proper attention to the Source Map may appear even more interesting of its application.
Tools and Resources
- Nick Fitzgerald fork of UglifyJS with Source Map support
- Paul Irish made a simple demo of Source Map
- Conrad Irwin wrote a convenient Source Map gem for Ruby developers.
- What else to read about the naming of eval and the displayName property
- You can see the source code of the Closure Compiler of creating the Source Map.
- Some screenshots and talk about support for GWT source maps
Source Map is a powerful tool for the developer. It allows you to keep the production code as compressed as possible, but at the same time allows you to debug it. It is also useful for novice developers to view code written by experienced developers, in order to learn how to properly structure and write their code without having to wade through minified code. What are you waiting for? Generate a Source Map for your project!
Source: https://habr.com/ru/post/148098/
All Articles