K-means clustering with Euclidean and Mahalanobis distance
In the previous article, I talked about how you can implement the k-means algorithm on c # with a generalized metric. In the comments, you can read the discussion of how appropriate it is to use different metrics, about the mathematical nature of the use of different metrics, and so on. I then wanted to give a beautiful example, but there was no suitable data at hand. And today I am faced with a task that illustrates well the advantages of using the Mahalanobis distance in k-means clustering. Details under the cut.
')
So, I had a certain array of 12-dimensional data, it was necessary to create a model to predict the thirteenth binary field, i.e. this is a classification task. Analysis as usual begins with the fact that I drive the entire array without any preprocessing into the classifier (I use neural networks), and then I look at the result in order to estimate the scale of the disaster. Rarely it gives a good result, but it allows you to understand how bad everything is. I was not surprised that the result was not the best, and I proceed to the next step of the analysis.
Visualization allows you to visually assess the data, for example, you can see that the data form several groups, then it is possible to perform clustering, and train the classifier for each cluster. It turns out a simple two-step hybrid model, based on the clustering result, the first classifier is built into several classes (clusters detected by the clustering algorithm), and then for each class / cluster its own classifier is used for the target field. As we know, the input k-means algorithm takes the number of clusters and splits the data into the specified number of groups. Instead of going through the number of clusters and looking for the lowest-cost partition, you can visualize the data and see these groups. But there is another problem, for example, by breaking the Euclidean distance data, we can get very implicit cluster boundaries, they will be very close to each other, and thus the accuracy of the system as a whole decreases.
So, I'm starting to visualize, but, really, visualizing 12-dimensional space is not very easy, so I need to reduce the dimension to 3 or 2. I first choose two, because it is easier. To reduce the dimension, I use the principal component method , by the way, the very implementation described in the previous article .
In the end, I got this picture:
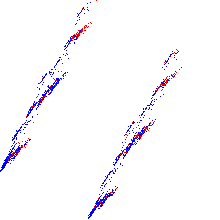
The blue and red dots are just two classes formed by the target field.
From the picture above it can be seen that the projection of the data forms two distinct groups with a very clear boundary. Now you need to do k-means clustering with parameter 2. But the question is what kind of metric to use for this. The Euclidean metric builds round Gaussians (why exactly Gaussians, you can read my commentary on the previous article ), but even with the naked eye it can be seen that if we describe the circles around the clusters, they will intersect.
Here is the clustering with the Euclidean metric:
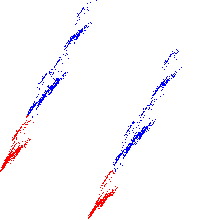
The border is very fuzzy, and indeed the clusters turned out to be completely not what they wanted.
Clustering with Mahalanobis distance builds ellipsoidal Gaussians, and for the first picture it is very easy to mentally draw two non-intersecting ellipses, described around clusters.
Here is the result of this clustering:
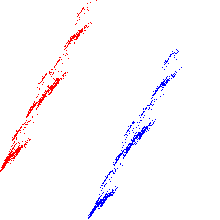
The profit is not clear yet or not, but clustering gave me two distinct groups of data, and now you can build the first step of the model. Or work with each of the clusters, as with a separate task. Further, for each group a classifier will be trained by the target field, and so on, but this is no longer within the framework of this article -)
Raw data processing
')
So, I had a certain array of 12-dimensional data, it was necessary to create a model to predict the thirteenth binary field, i.e. this is a classification task. Analysis as usual begins with the fact that I drive the entire array without any preprocessing into the classifier (I use neural networks), and then I look at the result in order to estimate the scale of the disaster. Rarely it gives a good result, but it allows you to understand how bad everything is. I was not surprised that the result was not the best, and I proceed to the next step of the analysis.
Visualization
Visualization allows you to visually assess the data, for example, you can see that the data form several groups, then it is possible to perform clustering, and train the classifier for each cluster. It turns out a simple two-step hybrid model, based on the clustering result, the first classifier is built into several classes (clusters detected by the clustering algorithm), and then for each class / cluster its own classifier is used for the target field. As we know, the input k-means algorithm takes the number of clusters and splits the data into the specified number of groups. Instead of going through the number of clusters and looking for the lowest-cost partition, you can visualize the data and see these groups. But there is another problem, for example, by breaking the Euclidean distance data, we can get very implicit cluster boundaries, they will be very close to each other, and thus the accuracy of the system as a whole decreases.
So, I'm starting to visualize, but, really, visualizing 12-dimensional space is not very easy, so I need to reduce the dimension to 3 or 2. I first choose two, because it is easier. To reduce the dimension, I use the principal component method , by the way, the very implementation described in the previous article .
In the end, I got this picture:
The blue and red dots are just two classes formed by the target field.
Clustering
From the picture above it can be seen that the projection of the data forms two distinct groups with a very clear boundary. Now you need to do k-means clustering with parameter 2. But the question is what kind of metric to use for this. The Euclidean metric builds round Gaussians (why exactly Gaussians, you can read my commentary on the previous article ), but even with the naked eye it can be seen that if we describe the circles around the clusters, they will intersect.
Here is the clustering with the Euclidean metric:
The border is very fuzzy, and indeed the clusters turned out to be completely not what they wanted.
Clustering with Mahalanobis distance builds ellipsoidal Gaussians, and for the first picture it is very easy to mentally draw two non-intersecting ellipses, described around clusters.
Here is the result of this clustering:
Profit
The profit is not clear yet or not, but clustering gave me two distinct groups of data, and now you can build the first step of the model. Or work with each of the clusters, as with a separate task. Further, for each group a classifier will be trained by the target field, and so on, but this is no longer within the framework of this article -)
Source: https://habr.com/ru/post/147973/
All Articles