God object. Analysis of complex projects
Introduction
It is not a secret for anyone that such an architectural antipattern as a God object prevents the effective maintenance of the project code. However, it can still be found in the Legacy-systems of the corporate sector. Over time, the code becomes so complicated that changing its functionality, even with Unit-testing, becomes a big problem. Nobody wants to support such systems, everyone is afraid to improve something, the number of problems in the tracker is kept constant, but it can grow. As a rule, the team has a fallen mood, which eventually becomes a suitcase: everyone wants to fall down.
Often in such cases, the general management takes a risky step: without stopping the support of the old system (you need to issue wages with something), start designing and developing a new system based on past experience. In the course of my work as an architect in one company, I had to bite into the system written before me, study it, catch patterns, business rules, and even make it so that the changes were cost-effective.
Look into the code
The analyzed system is a database access layer and is a class with an interface containing a large number of methods. Each method contains a SQL query to the database in the format of a string and a call to a helper class that performs parameter substitution, read and write data operations. This layer is used in the Web part of the application that calls the individual methods. This simple method has been used for many years. There were some attempts on the part of the developers to solve the urgent problem, however, they did not succeed: the required feature drowned out the process of improving the code base. In the end, the project, which began almost a decade ago, began to require major repairs.
')
It was necessary to prepare the code base of the project for a categorical and effective revision in a short time: break it down into understandable parts, clear of rudiments. In the end, I would like from one GodObject to get data access classes, each of which is responsible only for a particular part of the system, and not the entire system. It would be great to allocate such classes for each table, if it works.
Work plan
The problem was solved in several stages:
- Collect quantitative information code data access layer.
- Analysis of the number of tables used by the method.
- Analysis of the number of methods using the table.
- Clustering methods based on the tables they use.
- Grouping clusters according to the types of domain entities.
- Automatic refactoring of transfer of methods to calculated clusters-classes.
- Manual correction of special cases.
Bold highlighted those items that are discussed in this article. The rest is next.
Go!
Collection of quantitative information
Since the culminating stage of the task is clustering the obtained data, it is necessary to collect data in a form in which it would be convenient to reflect the relationships between methods and tables. In my opinion, this format can be a matrix, the rows of which reflect methods, the columns - tables, and the cells can take two values: 0 (the table is not used by the method) and 1 (the table is used by the method):
| Table 1 | table 2 | |
| Method 1 | one | one |
| Method 2 | 0 | one |
It remains only to collect such data by code. The data access layer is written in C #, which simplifies this task somewhat. There is such a project as NRefactory . It is a C # code parser and converter for such widely known IDEs as SharpDevelop and (more recently) MonoDevelop. It was not possible to find the current documentation for the current version, but there is an excellent demo from which the basic principles of working with the library are clear. For a couple of hours, an information collector
Analysis
After receiving the required matrix, I was interested to see how the graphs of the number of tables for one method and the number of methods per table look like, if after summing up by rows and columns, sort the data in descending order. The result is shown in Figures 1 and 2.

Picture 1.

Figure 2.
There are three areas in both plots:
1. The area of steep rise (at the beginning of the graphs).
2. Area of smooth descent (at the end of the graphs).
3. Area of the form “it seems to be an ascent, although it is already descent” (in the middle of the graphs).
We could ask some values to determine the corridor of the 3rd region, however, fast googling did not give any imputed results, and we didn’t want to develop our indicators based on an average - anyway, the game would go. Therefore, I divided both graphs into three clusters using the Kohonen map algorithm in the Deductor software. An example of the result for the case of the number of methods per table is shown in Figure 3.
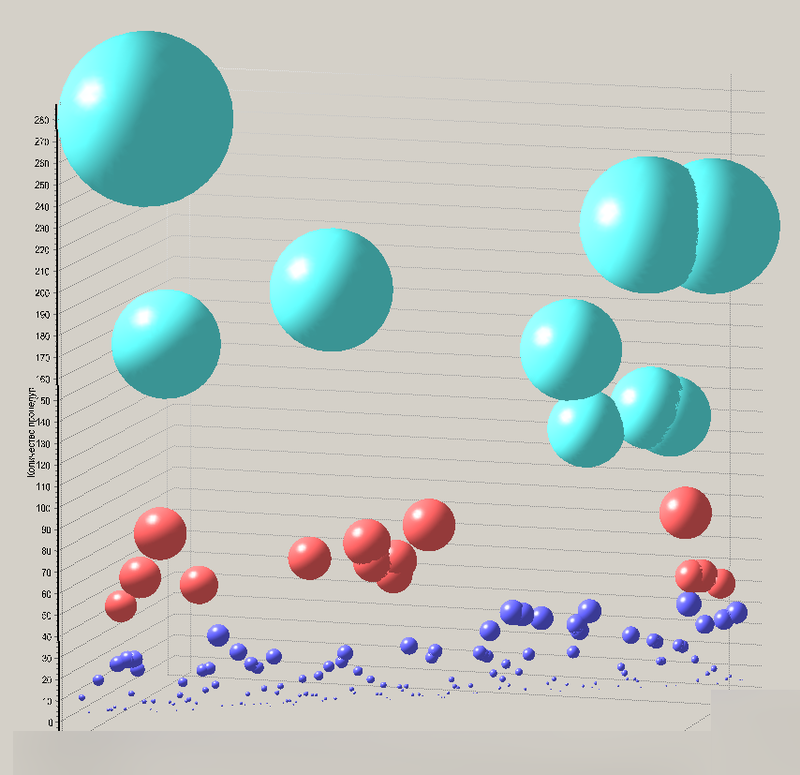
Figure 3. Chart of the result of table clustering. The tables are depicted as balls, the color of the ball is determined by the cluster number, and its radius is determined by the number of methods using this table.
Let us consider in more detail the diagram in Figure 3. It clearly shows that there are some such tables that are included in a large number of methods. I assume that the entities represented by these tables are basic, basic, “aggregation” (if to speak in DDD terminology): they are used in almost all business operations. The next stable group, marked in red, may be such entities that are the most characteristic representatives of individual services and modules of the system. This is the main field of action in the future. The latter group, marked in blue, consists of small entities that are most likely locally significant within the service. Thus, a draft of the system as a set of services, simple entities, and aggregation roots was obtained.
The next step is the same analysis of Figure 2, however, in this case, it can be assumed that the three groups identified (and another special case) are:
- Very complex methods, which clustering in automatic mode is unlikely to succeed. They represent a spooky spaghetti code that gathers pieces of a huge SQL query into a single demonic whole and has a dashing result in a user. Only handmade, only hardcore.
- Difficult methods with which there is still hope. You still have to refactor them with your hands, but you can try clustering.
- Simple methods affecting no more than 6 tables. The result of clustering should be very good.
- As a special case, you can select the methods that operate with just one table, for them, clustering is not necessary, here and everything is clear. Those. we have not even reached the climax part yet, and already almost 25% of all the work has been done.
Results
To summarize, the article turned out to be rather big, but still ahead. It was possible to look at the problem from a distance, find out some of the features of the subject area. It is already clear which objects are key, and which are minor. Further, on the basis of the selected methods operating with one table, it is already possible to select some classes. If we take into account that such methods are 25%, then the subtask of analysis is solved by a quarter already.
What's next?
In the next part (parts?): Analysis completion, automatic selection of classes based on clustering results, creation of a tool based on the Resharper SDK for more subtle selection of classes and methods in manual mode.
- Is it interesting to read an article on NRefactory?
- Should I write a separate article on refactoring writing in Resharper?
- Has anyone done something similar? The results are very interesting, something is not helping googling.
- And what do these charts look like?
Source: https://habr.com/ru/post/147834/
All Articles