Working with Java VisualVM during load testing
When developing any large WEB application, sooner or later the question arises of conducting load testing. Such a question arose in our project. How we solved it you can learn from this article.
The task was set as follows:
It is necessary that the application withstand a load of at least 1500 simultaneous users who will work according to the following scenario:
1. Open the application page
2. Login to the system
3. Downloading a large list of records from the database
4. Logout
Application deployed on IBM WebSphere Application Server 7
Apache JMeter 2.7 was chosen as a load tool.
We will see the test results using Java VisualVM
')
First, let's deploy our application to the Application Server (hereinafter WAS).
1. In the address bar of the browser, enter 'https: //% hostname%: 9043 / ibm / console / logon.jsp
2. Using the login and administrator password WAS get into the admin console itself
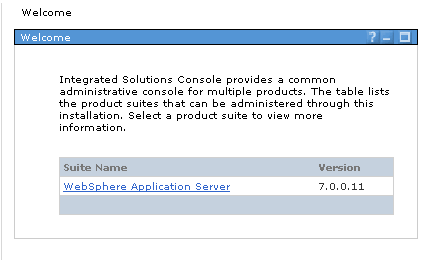
3. Go to Applications -> Application Types -> WebSphere enterprise applications and get to the page:
Enterprise Applications
Use this page to manage installed applications. A single application can be deployed to multiple servers.
After installing the application (using the cherished Install button), our console will look like this:
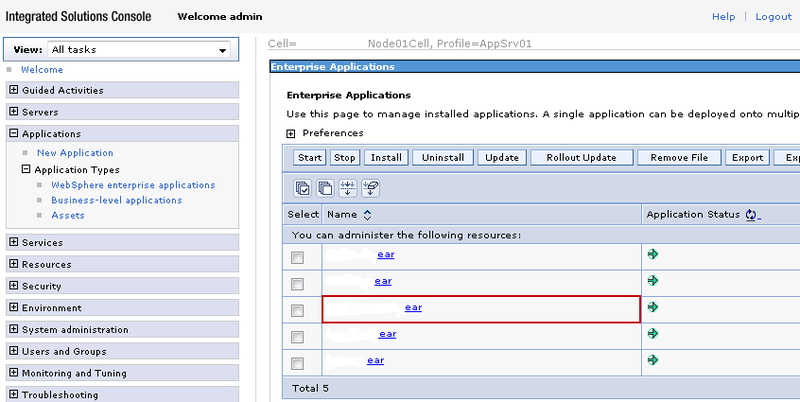
The red rectangle highlights the main project application. The rest are auxiliary modules.
Fine! We coped with it. Now you need to configure WAS for working with Java VisualVM. To do this, in the same AdminConsole, you must perform the following steps:
1. Servers -> Server Types -> WebSphere application servers -> server1 -> Java and Process Management -> Process definition -> Java Virtual Machine
Choose:
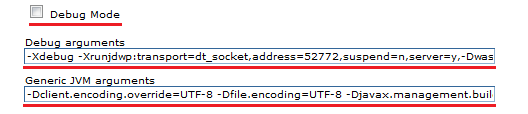
Flag
Debug Mode [false]
Debug arguments
-Xdebug -Xrunjdwp: transport = dt_socket, address = 52772, suspend = n, server = y, -Dwas.debug.mode = false
Generic JVM arguments
-Dclient.encoding.override = UTF-8 -Dfile.encoding = UTF-8 -Djavax.management.builder.initial = -Djava.rmi.server.hostname =% hostname% -Dcom.sun.management.jmxremote -Dcom. sun.management.jmxremote.port = 8686 -Dcom.sun.management.jmxremote.ssl = false -Dcom.sun.management.jmxremote.authenticate = false
* In the -Djava.rmi.server.hostname = argument, instead of% hostname%, you must specify the name of the host on which WAS is installed. % Signs are not put.
After setting the arguments and restarting the WAS service, you need to configure Java VisualVM itself
1. If you have Sun JDK 6u7 and higher, then you already have VisualVM. It is recommended to work with the latest version of Sun JDK 7, Java VisualVM is located in the $ JAVA_HOME \ jdk1.7.0 \ bin \ jvisualvm directory
Also Java VisualVM can be downloaded separately.
2. Run Java VisualVM. When you first start VisualVM may ask for a username and password, do not deny it
3. General view of Java VisualVM
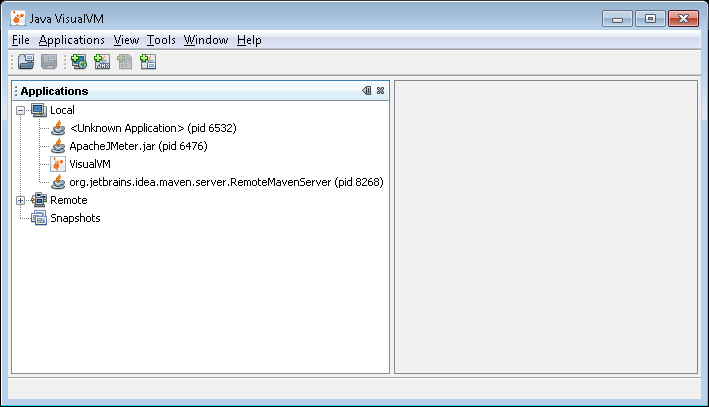
As you can see, several applications were locally defined, including VisualVM itself.
4. In the "Tools -> Plug-ins" menu on the Available Plugins tab, the available plug-ins are displayed, if you wish, select and install the necessary ones. For our purpose, they will not be needed, but it is worth knowing about them.
5. Add the remote host for which the previous settings were made:

6. Add JMX Connection. Be sure to specify port 8686 after the host name and click OK

7. After connecting to the remote host, select Open JMX Connection and you will be taken to the Overview of the desired process.
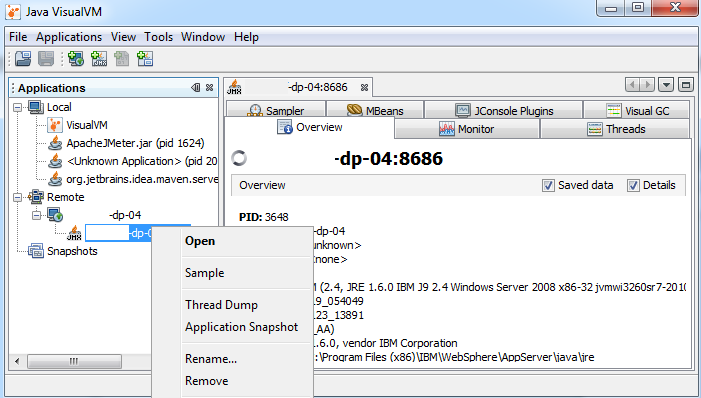
Here we will be interested in the Sampler tab (aka profiler). The profiler has two modes: CPU and Memory. The first profiles the methods in terms of the time spent in them, the second in terms of the objects created and destroyed. Unfortunately Memory sampling is not supported for remote applications.
For a more detailed view, select the desired method and click the Snapshot button, which will bring up a tree of methods (classes / packages) used for further analysis.
It is worth paying attention to the fact that this performance profiler is instrumental . That is, rewrites the application code, adding calls to it in the profiler.
Instrument profilers have rather large overheads, but they give the most accurate results. The work of such a profiler can quite strongly distort the operation of the application, but the overhead in theory will be evenly distributed across all methods.
How to create a project in JMeter on Habré has already been written repeatedly, besides, no one has canceled manuals, so this part of the article will be told only about the nuances that we encountered.
As the wonderful manual says, to work in JMeter you need to Configure your browser as follows:
But what to do if you work in Russia, and the application server is deployed in the Dnepropetrovsk CR, and besides, the corporate IT security policy blocks all connections that do not use the necessary Proxy is not written there. It was also found that if you work through the corporate proxy, the record in the Recording Controller did not go.
In our case, the following "fake ears" helped:
We connected to the application through the corporate Proxy, then in the browser settings, we changed the settings to localhost, reloaded the page and (wonderfully!) Worked on the remote host through localhost. Then we had from the power of 5-7 minutes to record the script at a pace of “wild panic”, after which the automatic configuration script changed the Proxy settings to the previous ones.
Create users and feed them JMeter.
A simple script was written that added 1500 entries to the tUsers table with unique logins TEST1-TEST1500. The password was all the same: 123456
Next to JMeter was added element SV Data Set Config
Now in the tree of recorded requests, we can find the element responsible for the login to the system. We had this ... / userLogin.web, which had the following meaning:
LoginService | login | java.lang.String / 2004016611 | TEST1 | 1 | 2 | 3 | 4 | 1 | 5 | 6 |
Here we see our login and password. Why JMeter recorded the password 123456 as 1 | 2 | 3 | 4 | 1 | 5 | 6 | still remains a mystery to me.
Now our task is as follows:
1. Create a * .csv file and place there 1500 view records
LoginService | login | java.lang.String / 2004016611 | TEST1 | 1 | 2 | 3 | 4 | 1 | 5 | 6 |
.
.
.
LoginService | login | java.lang.String / 2004016611 | TEST1500 | 1 | 2 | 3 | 4 | 1 | 5 | 6 |
2. Put this file in the same directory with the project
3. Show JMeter to take them from this file.
Small difficulties arose at the first stage.
Copy to cells A1 and A2
LoginService | login | java.lang.String / 2004016611 | TEST1
LoginService | login | java.lang.String / 2004016611 | TEST2
Excel and stretch to A1500
LoginService | login | java.lang.String / 2004016611 | TEST1500
no problems. Everything was also simple with the remaining part 1 | 2 | 3 | 4 | 1 | 5 | 6 |, which we copied 1,500 times without changes to cells B1-B1500. But after transferring all this stuff into a text file, it turned out not very nice:
LoginService | login | java.lang.String / 2004016611 | TEST1 | 1 | 2 | 3 | 4 | 1 | 5 | 6 |
It is clear that the extra spaces are completely useless to us. But how to remove them? Pens to edit 1500 entries - not our method. Having opened the file through Notepad ++, we tried to remove these spaces with the help of Replace, but, unfortunately, for it there is absolutely no difference for 1 where there is a space or 10. It does not see them and can only replace characters.
Then EmEditor came to our rescue. He calmly does all this:
After this incident, EmEditor has grown a lot in my eyes. As practice has shown, this text editor helps out in other cases, for example, when you need to change something in the * .xml file of an already deployed application. The same notebook or Notepad ++ gives up on this task and swears at access denied, but EmEditor does not.
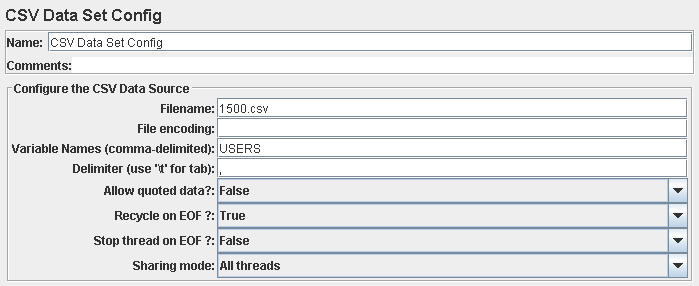
Renamed the prepared text file to 1500.csv and put it in the same folder as the project.
Now it remains to explain JMeter how to use all this.
To do this, in the SV Data Set Config we specify the file and set the name of the variable
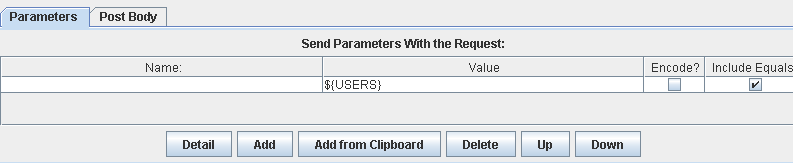
And in ... / userLogin.web we specify this variable in the form $ {VariableName}
In the apache-jmeter-2.7 \ bin directory, find the jmeter.bat file and open it with your favorite text editor.
Find part there
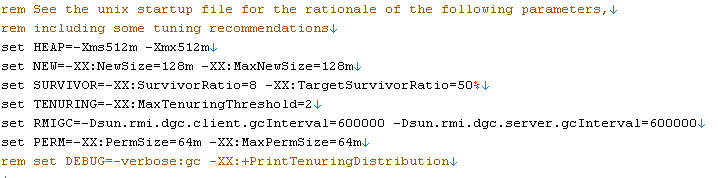
And for comfortable work we replace
set HEAP = -Xms512m -Xmx512m
on
set HEAP = -Xms1024m -Xmx1024m
This is also written in the jmeter startup manual (2.4 Running JMeter)
Now we have almost everything ready to run the script. It remains only to connect via RDP to our remote host and check that everything is fine (remove the parameters of the application server before testing):
As you can see, everything is within reason. We also look at how much memory the process of java.exe takes, which itself means WAS.
We run the test and see how 1500 virtual users happily rushed into our long-suffering application. In the meantime, we again switch to the remote table and see what happens there:

The application server CPU was 100% occupied during the entire test, which is not good at all. So fall not long.
We look now in VisualVM, the picture is not very joyful:
Go to Sampler and see what CPU loads like this:

Look in the SystemError log of the sphere:
R log4j: WARN Continuable parsing error 209 and column 14
R log4j: WARN The content of an element of type "logger" must match "(param *, level?, Appender-ref *)".
R log4j: WARN No appenders could be found for logger (org.springframework.web.context.support.XmlWebApplicationContext).
R log4j: WARN Please initialize the log4j system properly.
R log4j: WARN See logging.apache.org/log4j/1.2/faq.html#noconfig for more info.
... and we understand who is to blame.
We check our assumption.
To do this, find the folder with the deployed application in% WAS_HOME% \ AppServer \ profiles \ AppSrv01 \ installedApps \% HostName% Node01Cell \ app.ear \ app.war \ WEB-INF \. We find there the file log4j.xml and in it wherever there are constructions of the form 'level value = "ANY LEVEL", we replace this level with the value off. After this, we restart the WAS service.
Run the test again:
It is quite another matter!
In this article, we reviewed the full cycle of setting up the environment for conducting load testing of a WEB application. It is clear that the case with log4j alone was not limited; many other improvements were subsequently carried out, but I hope that the main point of the work is clear.
If you have any questions, I will be happy to answer them. Thanks for attention.

Actually, what are we going to do
The task was set as follows:
It is necessary that the application withstand a load of at least 1500 simultaneous users who will work according to the following scenario:
1. Open the application page
2. Login to the system
3. Downloading a large list of records from the database
4. Logout
Characters
Application deployed on IBM WebSphere Application Server 7
Apache JMeter 2.7 was chosen as a load tool.
We will see the test results using Java VisualVM
')
How to make it all work?
We configure Application Server
First, let's deploy our application to the Application Server (hereinafter WAS).
1. In the address bar of the browser, enter 'https: //% hostname%: 9043 / ibm / console / logon.jsp
2. Using the login and administrator password WAS get into the admin console itself
3. Go to Applications -> Application Types -> WebSphere enterprise applications and get to the page:
Enterprise Applications
Use this page to manage installed applications. A single application can be deployed to multiple servers.
After installing the application (using the cherished Install button), our console will look like this:
The red rectangle highlights the main project application. The rest are auxiliary modules.
Fine! We coped with it. Now you need to configure WAS for working with Java VisualVM. To do this, in the same AdminConsole, you must perform the following steps:
1. Servers -> Server Types -> WebSphere application servers -> server1 -> Java and Process Management -> Process definition -> Java Virtual Machine
Choose:
Flag
Debug Mode [false]
Debug arguments
-Xdebug -Xrunjdwp: transport = dt_socket, address = 52772, suspend = n, server = y, -Dwas.debug.mode = false
Generic JVM arguments
-Dclient.encoding.override = UTF-8 -Dfile.encoding = UTF-8 -Djavax.management.builder.initial = -Djava.rmi.server.hostname =% hostname% -Dcom.sun.management.jmxremote -Dcom. sun.management.jmxremote.port = 8686 -Dcom.sun.management.jmxremote.ssl = false -Dcom.sun.management.jmxremote.authenticate = false
* In the -Djava.rmi.server.hostname = argument, instead of% hostname%, you must specify the name of the host on which WAS is installed. % Signs are not put.
Customize Java VisualVM
After setting the arguments and restarting the WAS service, you need to configure Java VisualVM itself
1. If you have Sun JDK 6u7 and higher, then you already have VisualVM. It is recommended to work with the latest version of Sun JDK 7, Java VisualVM is located in the $ JAVA_HOME \ jdk1.7.0 \ bin \ jvisualvm directory
Also Java VisualVM can be downloaded separately.
2. Run Java VisualVM. When you first start VisualVM may ask for a username and password, do not deny it
3. General view of Java VisualVM
As you can see, several applications were locally defined, including VisualVM itself.
4. In the "Tools -> Plug-ins" menu on the Available Plugins tab, the available plug-ins are displayed, if you wish, select and install the necessary ones. For our purpose, they will not be needed, but it is worth knowing about them.
5. Add the remote host for which the previous settings were made:
6. Add JMX Connection. Be sure to specify port 8686 after the host name and click OK
7. After connecting to the remote host, select Open JMX Connection and you will be taken to the Overview of the desired process.
Here we will be interested in the Sampler tab (aka profiler). The profiler has two modes: CPU and Memory. The first profiles the methods in terms of the time spent in them, the second in terms of the objects created and destroyed. Unfortunately Memory sampling is not supported for remote applications.
For a more detailed view, select the desired method and click the Snapshot button, which will bring up a tree of methods (classes / packages) used for further analysis.
Important!
It is worth paying attention to the fact that this performance profiler is instrumental . That is, rewrites the application code, adding calls to it in the profiler.
Instrument profilers have rather large overheads, but they give the most accurate results. The work of such a profiler can quite strongly distort the operation of the application, but the overhead in theory will be evenly distributed across all methods.
Create a project in JMeter
How to create a project in JMeter on Habré has already been written repeatedly, besides, no one has canceled manuals, so this part of the article will be told only about the nuances that we encountered.
Localhost
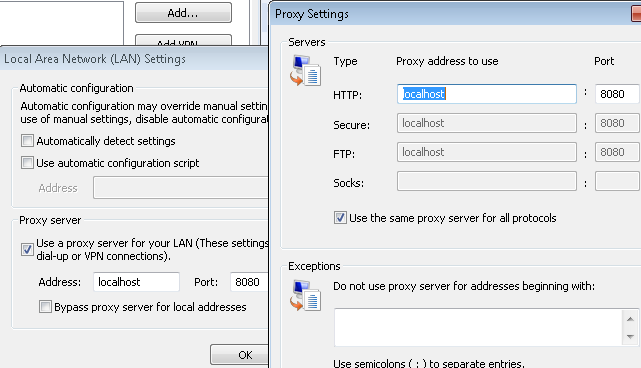
As the wonderful manual says, to work in JMeter you need to Configure your browser as follows:
But what to do if you work in Russia, and the application server is deployed in the Dnepropetrovsk CR, and besides, the corporate IT security policy blocks all connections that do not use the necessary Proxy is not written there. It was also found that if you work through the corporate proxy, the record in the Recording Controller did not go.
In our case, the following "fake ears" helped:
We connected to the application through the corporate Proxy, then in the browser settings, we changed the settings to localhost, reloaded the page and (wonderfully!) Worked on the remote host through localhost. Then we had from the power of 5-7 minutes to record the script at a pace of “wild panic”, after which the automatic configuration script changed the Proxy settings to the previous ones.
Name is Legion!
Create users and feed them JMeter.
A simple script was written that added 1500 entries to the tUsers table with unique logins TEST1-TEST1500. The password was all the same: 123456
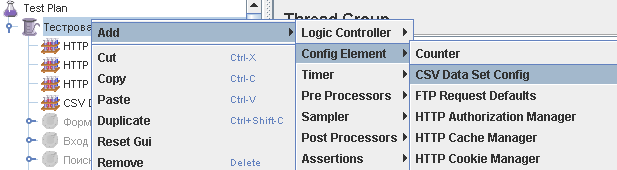
Next to JMeter was added element SV Data Set Config
Now in the tree of recorded requests, we can find the element responsible for the login to the system. We had this ... / userLogin.web, which had the following meaning:
LoginService | login | java.lang.String / 2004016611 | TEST1 | 1 | 2 | 3 | 4 | 1 | 5 | 6 |
Here we see our login and password. Why JMeter recorded the password 123456 as 1 | 2 | 3 | 4 | 1 | 5 | 6 | still remains a mystery to me.
Now our task is as follows:
1. Create a * .csv file and place there 1500 view records
LoginService | login | java.lang.String / 2004016611 | TEST1 | 1 | 2 | 3 | 4 | 1 | 5 | 6 |
.
.
.
LoginService | login | java.lang.String / 2004016611 | TEST1500 | 1 | 2 | 3 | 4 | 1 | 5 | 6 |
2. Put this file in the same directory with the project
3. Show JMeter to take them from this file.
Small difficulties arose at the first stage.
Copy to cells A1 and A2
LoginService | login | java.lang.String / 2004016611 | TEST1
LoginService | login | java.lang.String / 2004016611 | TEST2
Excel and stretch to A1500
LoginService | login | java.lang.String / 2004016611 | TEST1500
no problems. Everything was also simple with the remaining part 1 | 2 | 3 | 4 | 1 | 5 | 6 |, which we copied 1,500 times without changes to cells B1-B1500. But after transferring all this stuff into a text file, it turned out not very nice:
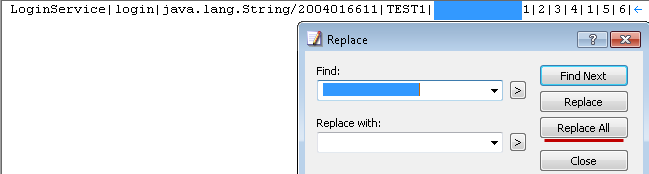
LoginService | login | java.lang.String / 2004016611 | TEST1 | 1 | 2 | 3 | 4 | 1 | 5 | 6 |
It is clear that the extra spaces are completely useless to us. But how to remove them? Pens to edit 1500 entries - not our method. Having opened the file through Notepad ++, we tried to remove these spaces with the help of Replace, but, unfortunately, for it there is absolutely no difference for 1 where there is a space or 10. It does not see them and can only replace characters.
Then EmEditor came to our rescue. He calmly does all this:
After this incident, EmEditor has grown a lot in my eyes. As practice has shown, this text editor helps out in other cases, for example, when you need to change something in the * .xml file of an already deployed application. The same notebook or Notepad ++ gives up on this task and swears at access denied, but EmEditor does not.
Renamed the prepared text file to 1500.csv and put it in the same folder as the project.
Now it remains to explain JMeter how to use all this.
To do this, in the SV Data Set Config we specify the file and set the name of the variable
And in ... / userLogin.web we specify this variable in the form $ {VariableName}
We increase a bunch
In the apache-jmeter-2.7 \ bin directory, find the jmeter.bat file and open it with your favorite text editor.
Find part there
And for comfortable work we replace
set HEAP = -Xms512m -Xmx512m
on
set HEAP = -Xms1024m -Xmx1024m
This is also written in the jmeter startup manual (2.4 Running JMeter)
Finishing touches
Now we have almost everything ready to run the script. It remains only to connect via RDP to our remote host and check that everything is fine (remove the parameters of the application server before testing):
As you can see, everything is within reason. We also look at how much memory the process of java.exe takes, which itself means WAS.
Test it's your time
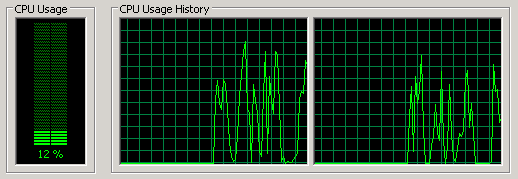
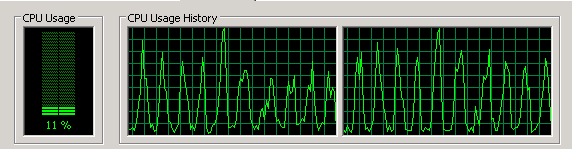
We run the test and see how 1500 virtual users happily rushed into our long-suffering application. In the meantime, we again switch to the remote table and see what happens there:
The application server CPU was 100% occupied during the entire test, which is not good at all. So fall not long.
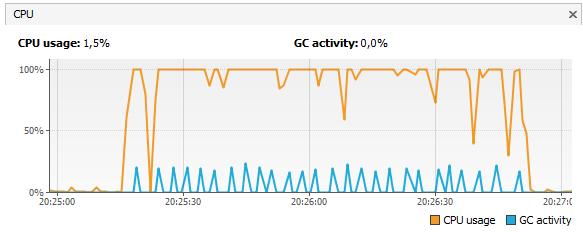
We look now in VisualVM, the picture is not very joyful:
Go to Sampler and see what CPU loads like this:
Look in the SystemError log of the sphere:
R log4j: WARN Continuable parsing error 209 and column 14
R log4j: WARN The content of an element of type "logger" must match "(param *, level?, Appender-ref *)".
R log4j: WARN No appenders could be found for logger (org.springframework.web.context.support.XmlWebApplicationContext).
R log4j: WARN Please initialize the log4j system properly.
R log4j: WARN See logging.apache.org/log4j/1.2/faq.html#noconfig for more info.
... and we understand who is to blame.
We check our assumption.
To do this, find the folder with the deployed application in% WAS_HOME% \ AppServer \ profiles \ AppSrv01 \ installedApps \% HostName% Node01Cell \ app.ear \ app.war \ WEB-INF \. We find there the file log4j.xml and in it wherever there are constructions of the form 'level value = "ANY LEVEL", we replace this level with the value off. After this, we restart the WAS service.
Run the test again:
It is quite another matter!
results
In this article, we reviewed the full cycle of setting up the environment for conducting load testing of a WEB application. It is clear that the case with log4j alone was not limited; many other improvements were subsequently carried out, but I hope that the main point of the work is clear.
If you have any questions, I will be happy to answer them. Thanks for attention.
Source: https://habr.com/ru/post/146988/
All Articles