Remote debugging using xdebug port forwarding
Every developer from time to time is faced with incomprehensible errors. As a rule, their reason is not obvious and in order to fix them, you need to understand in detail what is happening in the code. The xdebug module is a professional error search tool. When code execution reaches a breakpoint, xdebug joins the IDE, which listens to the port (9000 by default). This scheme works well on localhost. If you are in direct line of sight to the remote server, then you can set your ip in the xdebug config file and debug it in the same way. But if the developer's computer is behind NAT, then direct access from the server to it is impossible.
I have been using xdebug on localhost for a long time, but, having understood port forwarding, I learned how to debug on a remote server and decided to write an instruction that can be useful to every developer, and most importantly - it works.
As an IDE, I used PhpStorm, the Chrome browser, Ubuntu OS. Port forwarding works without problems in windows.
The xdebug.idekey option can be phpStorm1, netbeans-xdebug, XDEBUG_ECLIPSE, depending on the IDE, or empty.
As a result, phpinfo () output should contain information about xdebug:

If you plan to use idekey, then for Chrome you need to put the Xdebug helper .
In the settings of the extension parameter IDE key, you need to specify PhpStorm1 and in the Domain filter enter the host. When debugging in the address bar, you need to click Debugging Enabled.

File -> Settings -> xdebug. Port 9000. In the Edit debug configuration panel -> Add New Configuration -> PHP Web Application
You need to specify the Name, Start URL, create a new server. At the server, specify the Name, Host, Port, path mapping. Save all.
Now you can set a breakpoint and click on the debug button so that the IDE starts listening to the port. A browser will start with the Server + Start URL page, and in the parameter there will be XDEBUG_SESSION_START, which defines the session identifier. Do not lose it when debugging.
')
Xdebug is knocking on the port that the IDE is listening to. If we want to debug a remote server and sit behind NAT, then our ports are inaccessible. The best option is to redirect the remote port to the local one using ssh. To work under windows you need to install Cygwin with the ssh package.
You need to try to establish a connection on a remote machine to its 9000 port. If everything is done correctly, the connection will be established, in fact, with our local port.
Successful connection:
Hot key to exit telnet session - Ctrl +].
Possible mistakes:
I have been using xdebug on localhost for a long time, but, having understood port forwarding, I learned how to debug on a remote server and decided to write an instruction that can be useful to every developer, and most importantly - it works.
As an IDE, I used PhpStorm, the Chrome browser, Ubuntu OS. Port forwarding works without problems in windows.
Server settings
sudo apt-get install php5-xdebug sudo nano /etc/php5/conf.d/xdebug.ini The xdebug.idekey option can be phpStorm1, netbeans-xdebug, XDEBUG_ECLIPSE, depending on the IDE, or empty.
zend_extension=/usr/lib/php5/20100525/xdebug.so xdebug.profiler_enable = 0 xdebug.remote_enable = 1 xdebug.remote_host = 127.0.0.1 xdebug.remote_port=9000 xdebug.remote_handler=dbgp xdebug.idekey=PhpStorm1 As a result, phpinfo () output should contain information about xdebug:
Client settings
Chrome Xdebug helper
If you plan to use idekey, then for Chrome you need to put the Xdebug helper .
In the settings of the extension parameter IDE key, you need to specify PhpStorm1 and in the Domain filter enter the host. When debugging in the address bar, you need to click Debugging Enabled.
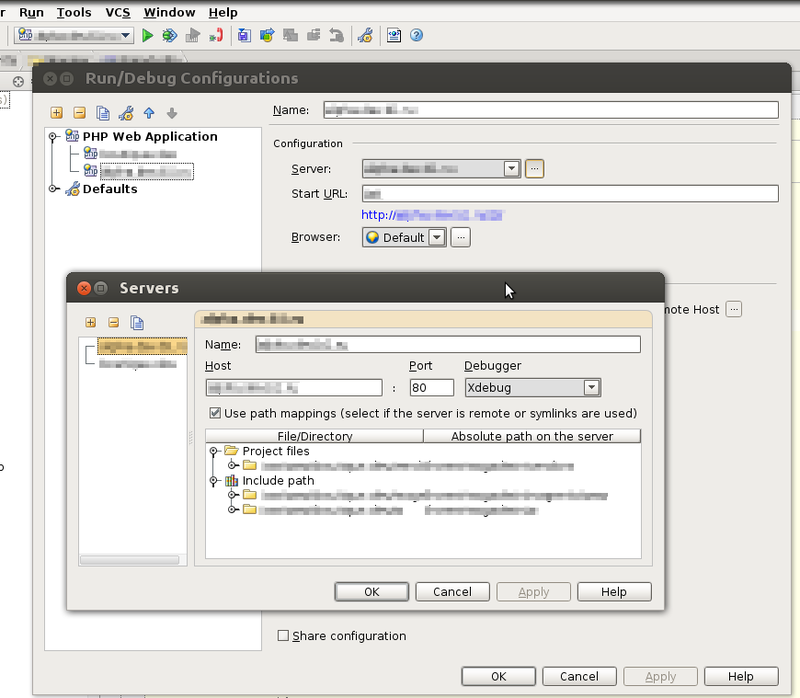
Setting PhpStorm
File -> Settings -> xdebug. Port 9000. In the Edit debug configuration panel -> Add New Configuration -> PHP Web Application
You need to specify the Name, Start URL, create a new server. At the server, specify the Name, Host, Port, path mapping. Save all.
Now you can set a breakpoint and click on the debug button so that the IDE starts listening to the port. A browser will start with the Server + Start URL page, and in the parameter there will be XDEBUG_SESSION_START, which defines the session identifier. Do not lose it when debugging.
')
Port forwarding
Xdebug is knocking on the port that the IDE is listening to. If we want to debug a remote server and sit behind NAT, then our ports are inaccessible. The best option is to redirect the remote port to the local one using ssh. To work under windows you need to install Cygwin with the ssh package.
$ ssh -R 9000:127.0.0.1:9000 user@server Port forwarding check
You need to try to establish a connection on a remote machine to its 9000 port. If everything is done correctly, the connection will be established, in fact, with our local port.
Successful connection:
> telnet 127.0.0.1 9000 Trying 127.0.0.1... Connected to 127.0.0.1. Escape character is '^]'. Hot key to exit telnet session - Ctrl +].
Possible mistakes:
telnet: Unable to connect to remote host: Connection refused - . . Connection closed by foreign host - IDE Source: https://habr.com/ru/post/146547/
All Articles