3D-simulator data center with reference to the monitoring
We build data centers (data centers) and maintain them constantly. Recently, we have a new software that just admires. Below are some screenshots from the data center visualization interface:
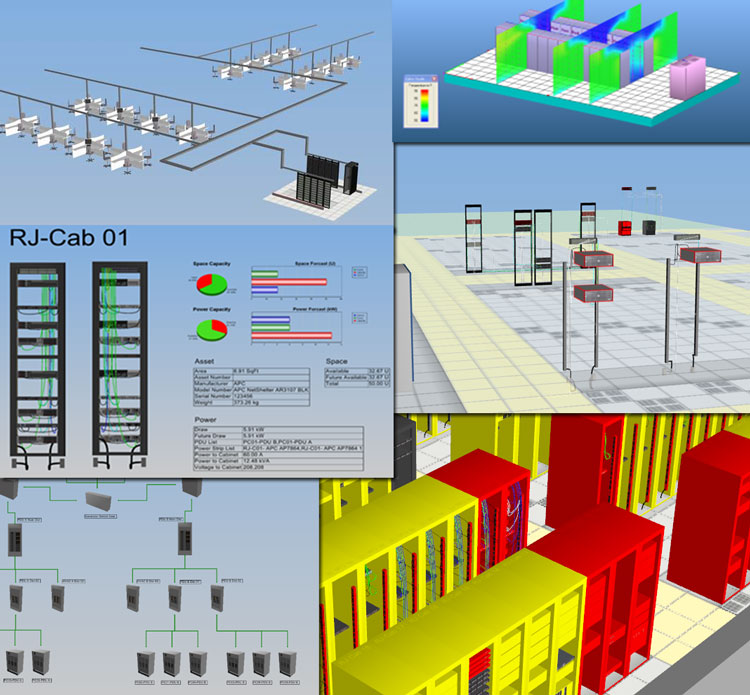
Here you can see switching, details on racks (for example, free ports), power management, temperature monitoring in different parts of the machine room, visualization of associated equipment and visual analysis of equipment when applying a disaster recovery plan.
')
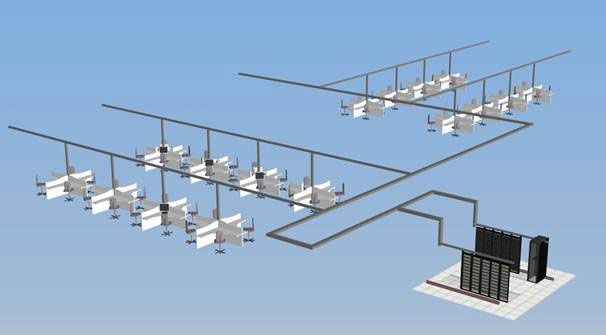
This is what a simplified view looks like (roughly similar views were in the old visualization software):

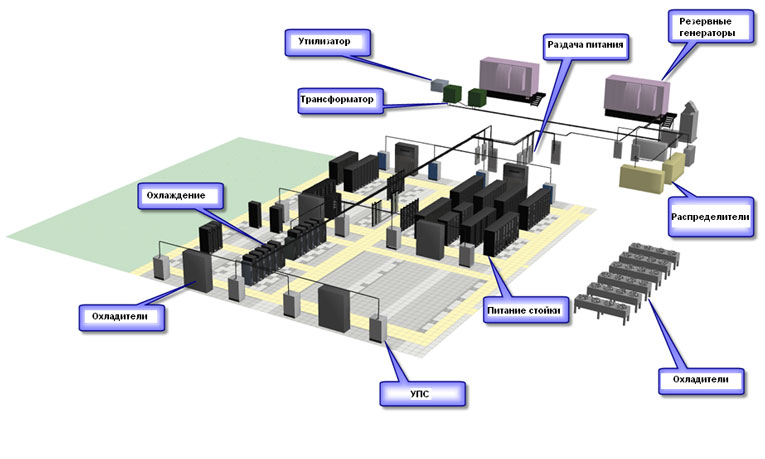
This is the power scheme:
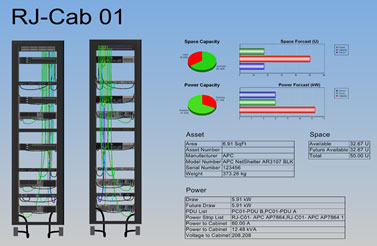
Detailed analysis:
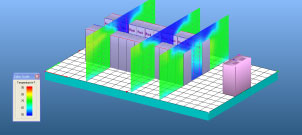
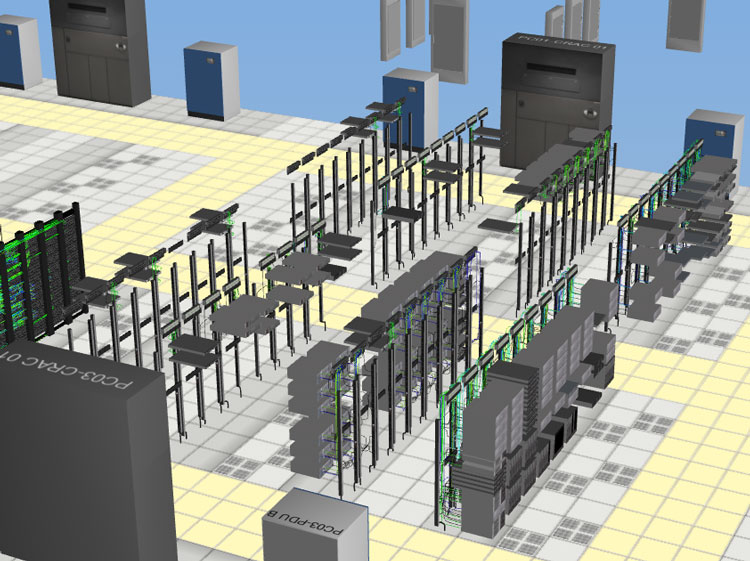
Temperature control in the hall:
Network infrastructure:
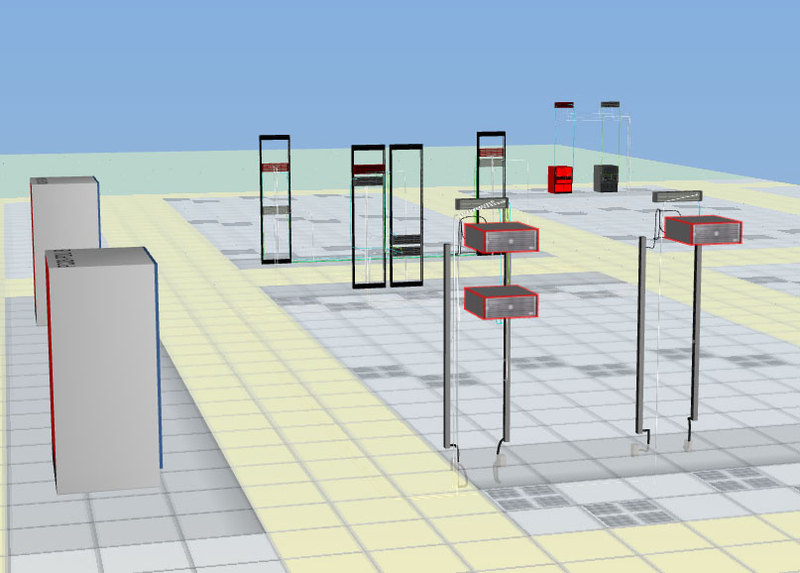
Hardware dependency for risk planning and disaster recovery plans:

Information on hardware, for example, the number of free ports, how the switching is carried out, the place:
Visual representations of workflows:

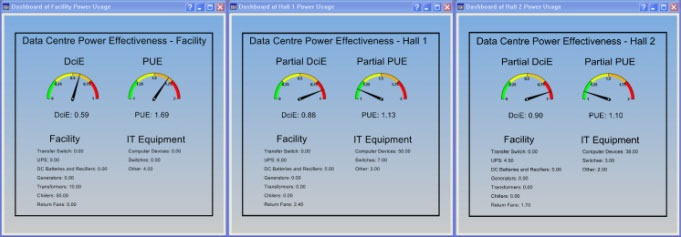
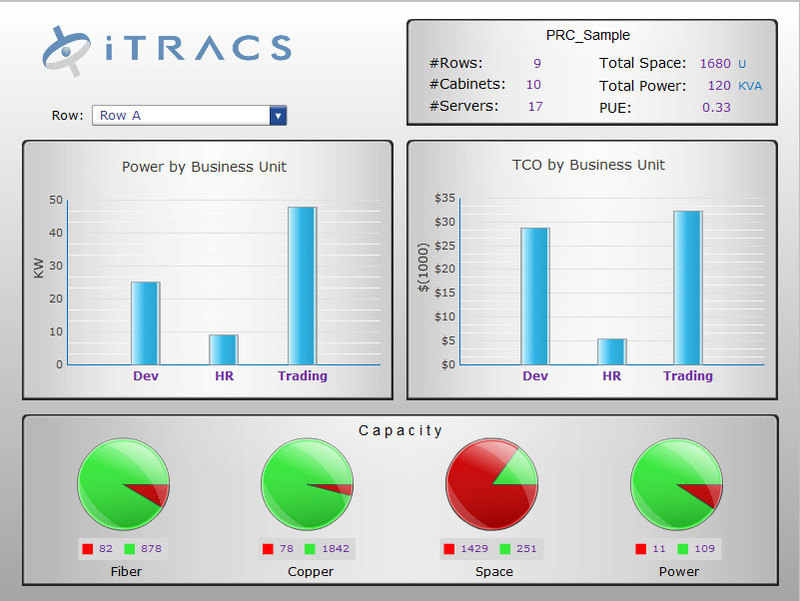
And usual analytics:
The ability to visually see your data center infrastructure in 3D is more relevant and accessible to people about all components and processes. In our data centers there are banks, large state-owned companies and other customers of a similar level, therefore any step towards “making it clearer” is very useful. Visibility and ease of presentation makes it easier to monitor the data center, plus you can make more deliberate decisions when servicing, capacity planning, expansion, relocation, rearrangement, and so on.
Suppose we are launching a new room with 200 racks in our own data center. It is planned to purchase a certain fleet of equipment, new computing power for a specific customer from, let's say, a very responsible area. It is necessary to calculate the power:
All this is traditionally considered in ordinary programs, but in the visualization system we can “arrange” the equipment, switch all the components and drive away hundreds of test use cases (including disaster recovery). The system quickly and simply shows that, for example, we have such a certain amount of free space in such and such places, there is such an opportunity for the generation of electricity for this set of equipment, there is such a network capacity, a cooling system, and so on. .
If you have ever worked with printed circuit boards, you know how difficult it is to calculate the optimal layout of components from the first time. This is usually a couple of days of automatic runs and manual component swapping. When setting the equipment in the data center, we have about a similar puzzle. The new system receives input information, thinks, and then proposes a plan for the placement of equipment with the optimization of all parameters. The engineer, who will be engaged in the arrangement of this equipment, can see in the system how it will look “live”, rearrange the components in places, see the operation in the simulation system and approve the scheme.
When the time comes to start work, the calendar event will work, and the system will automatically notify the staff. It will generate tasks for the necessary engineers, where it will be described what they need to do, what equipment to put (with visualization pictures and connection diagrams).
You can do the optimization of existing iron. Suppose the system can calculate that the space in the cabinets is inefficiently used: equipment is scattered around the cabinets, and you can fill the cabinets so that there is still room for other tasks. Also, the system can control energy consumption, and help us reduce the cost of food.
Before the introduction, skeptical voices sounded: they say, why do we need 3D-visualization, if everything is perfectly visible on ordinary 2D schemes? After the first tests, the questions completely disappeared. 3D is needed for clarity: these are not just funny pictures, but really useful infographics. For example, an operator can locate a problem more quickly, which is important. The sweetest thing is that external monitoring systems can be tied to this visualization, and an indication can be made: the system will show that, for example, there is a problem on this node.
Plus we can quickly see the dependencies. Suppose we have a failed UPS. We are interested in finding out what influenced this, and in these 3D images we can select the device we are interested in and apply a filter to it. The filter will show which equipment depends directly and which one is connected to a power source, for example, via a backup line. You can see all the interaction chains: this is very effective in developing so-called disaster recovery plans (DRP). You can always see what these or other components depend on, and not necessarily on nutrition, but, for example, on the network component. Suppose there is a nodal router, you can click on it and see which components interact at all through this router. As a result, we will understand what will happen if it fails, which systems will be unavailable.
There are analytical reports, you can develop visual presentations (dashboards) for end users, in which aggregated information will be already collected. By the way, switching to 2D is very simple: all schemes have a flat view — for web interfaces, for example.
Each object is not just a server or router model, components can be modular: a server, in principle, can be “disassembled” before the power supply. Each object has its own attributes that can be monitored, some passport characteristics, and so on. The operator can at any time in the picture open the cabinet, look at the server, select the components of this server, get information on them - so it is quite convenient.
The system contains all the components that are used in the work of the data center, and each of them is taken into account from the point of view of energy consumption. Knowing the real situation (the system also integrates with monitoring systems that capture data in real time) we can add data from temperature sensors and build thermal maps that show the temperature distribution in the data center.
The library comes with a library of typical types of hardware that can be found in the data center, for example, large vendor servers, UPS, power distribution modules, server cabinets, network cards, power supplies, and so on. All similar hardware has ready-made templates with characteristics (weight, power consumption, dimensions, etc.) and links to the manufacturer's website. You can create your own templates.
Cables are detailed by type and service, for example, you can select only VLAN.
The data center building is also modeled by the system.
The system also shows them, which is very convenient for reporting on resources. Software components on different servers can be combined into common logical blocks. For example, you can combine the equipment responsible for providing services to the client’s financial department, logistics department, sales department and so on into one unit, plus assigning each group its own color on the main picture.
On the server there is a database of models and a server part. On thick client workstations, a fat client is installed. Web clients are connected to the server, rendering everything in 2D. In the case of a distributed infrastructure, it is possible to install additional servers and configure the synchronization of the inventory database between them (this is useful when the hardware is physically in different data centers).
It works like any useful tool: it seems you didn’t need it before the introduction, but after the first tests it became clear that it wouldn’t be possible to abandon the system, it was too good. There comes an almost physical sense of order and control, this is very cool.
PS The post was written together with Alexey Akopyan (he is not on Habré).
Here you can see switching, details on racks (for example, free ports), power management, temperature monitoring in different parts of the machine room, visualization of associated equipment and visual analysis of equipment when applying a disaster recovery plan.
')
What can be seen?
This is what a simplified view looks like (roughly similar views were in the old visualization software):
This is the power scheme:
Detailed analysis:
Temperature control in the hall:
Network infrastructure:
Hardware dependency for risk planning and disaster recovery plans:
Information on hardware, for example, the number of free ports, how the switching is carried out, the place:
Visual representations of workflows:
And usual analytics:
Why do we need data center visualization?
The ability to visually see your data center infrastructure in 3D is more relevant and accessible to people about all components and processes. In our data centers there are banks, large state-owned companies and other customers of a similar level, therefore any step towards “making it clearer” is very useful. Visibility and ease of presentation makes it easier to monitor the data center, plus you can make more deliberate decisions when servicing, capacity planning, expansion, relocation, rearrangement, and so on.
How does this help in maintenance?
Suppose we are launching a new room with 200 racks in our own data center. It is planned to purchase a certain fleet of equipment, new computing power for a specific customer from, let's say, a very responsible area. It is necessary to calculate the power:
- By nutrition.
- By how to arrange this technique.
- According to the optimal cooling parameters and so on.
All this is traditionally considered in ordinary programs, but in the visualization system we can “arrange” the equipment, switch all the components and drive away hundreds of test use cases (including disaster recovery). The system quickly and simply shows that, for example, we have such a certain amount of free space in such and such places, there is such an opportunity for the generation of electricity for this set of equipment, there is such a network capacity, a cooling system, and so on. .
If you have ever worked with printed circuit boards, you know how difficult it is to calculate the optimal layout of components from the first time. This is usually a couple of days of automatic runs and manual component swapping. When setting the equipment in the data center, we have about a similar puzzle. The new system receives input information, thinks, and then proposes a plan for the placement of equipment with the optimization of all parameters. The engineer, who will be engaged in the arrangement of this equipment, can see in the system how it will look “live”, rearrange the components in places, see the operation in the simulation system and approve the scheme.
When the time comes to start work, the calendar event will work, and the system will automatically notify the staff. It will generate tasks for the necessary engineers, where it will be described what they need to do, what equipment to put (with visualization pictures and connection diagrams).
You can do the optimization of existing iron. Suppose the system can calculate that the space in the cabinets is inefficiently used: equipment is scattered around the cabinets, and you can fill the cabinets so that there is still room for other tasks. Also, the system can control energy consumption, and help us reduce the cost of food.
Is 3D fun or is it really useful?
Before the introduction, skeptical voices sounded: they say, why do we need 3D-visualization, if everything is perfectly visible on ordinary 2D schemes? After the first tests, the questions completely disappeared. 3D is needed for clarity: these are not just funny pictures, but really useful infographics. For example, an operator can locate a problem more quickly, which is important. The sweetest thing is that external monitoring systems can be tied to this visualization, and an indication can be made: the system will show that, for example, there is a problem on this node.
Plus we can quickly see the dependencies. Suppose we have a failed UPS. We are interested in finding out what influenced this, and in these 3D images we can select the device we are interested in and apply a filter to it. The filter will show which equipment depends directly and which one is connected to a power source, for example, via a backup line. You can see all the interaction chains: this is very effective in developing so-called disaster recovery plans (DRP). You can always see what these or other components depend on, and not necessarily on nutrition, but, for example, on the network component. Suppose there is a nodal router, you can click on it and see which components interact at all through this router. As a result, we will understand what will happen if it fails, which systems will be unavailable.
There are analytical reports, you can develop visual presentations (dashboards) for end users, in which aggregated information will be already collected. By the way, switching to 2D is very simple: all schemes have a flat view — for web interfaces, for example.
How deep is the detail in the picture?
Each object is not just a server or router model, components can be modular: a server, in principle, can be “disassembled” before the power supply. Each object has its own attributes that can be monitored, some passport characteristics, and so on. The operator can at any time in the picture open the cabinet, look at the server, select the components of this server, get information on them - so it is quite convenient.
The system contains all the components that are used in the work of the data center, and each of them is taken into account from the point of view of energy consumption. Knowing the real situation (the system also integrates with monitoring systems that capture data in real time) we can add data from temperature sensors and build thermal maps that show the temperature distribution in the data center.
The library comes with a library of typical types of hardware that can be found in the data center, for example, large vendor servers, UPS, power distribution modules, server cabinets, network cards, power supplies, and so on. All similar hardware has ready-made templates with characteristics (weight, power consumption, dimensions, etc.) and links to the manufacturer's website. You can create your own templates.
Cables are detailed by type and service, for example, you can select only VLAN.
The data center building is also modeled by the system.
What about virtual machines?
The system also shows them, which is very convenient for reporting on resources. Software components on different servers can be combined into common logical blocks. For example, you can combine the equipment responsible for providing services to the client’s financial department, logistics department, sales department and so on into one unit, plus assigning each group its own color on the main picture.
What else is needed for such a system?
- To simplify the inventory of equipment.
- Creation of “data center simulators”, when equipment can be “examined” without physically entering the computer room and building entire “planned” halls according to this principle.
- Intellectual commissioning.
- Visualization of power circuits and network switching.
- For capacity planning.
- To optimize the placement of equipment.
- For automatic generation of work orders to engineers.
- Convenient control of basic SNMP-metrics on data center infrastructure equipment.
- Energy management.
- In emergency situations (so far only at the training, there was no real emergency).
- Office moving departments.
- Simple management of multiple resources and activities.
What is architecture?
On the server there is a database of models and a server part. On thick client workstations, a fat client is installed. Web clients are connected to the server, rendering everything in 2D. In the case of a distributed infrastructure, it is possible to install additional servers and configure the synchronization of the inventory database between them (this is useful when the hardware is physically in different data centers).
Total: take off?
It works like any useful tool: it seems you didn’t need it before the introduction, but after the first tests it became clear that it wouldn’t be possible to abandon the system, it was too good. There comes an almost physical sense of order and control, this is very cool.
PS The post was written together with Alexey Akopyan (he is not on Habré).
Source: https://habr.com/ru/post/146536/
All Articles